Research Article
Volume 1 Issue 3 - 2017
Rasagiline-Loaded PLGA Nanoparticles: Design and Evaluation
PDM College of Pharmacy, PDM University, B’garh, India
*Corresponding Author: Vikash Kumar, PDM College of Pharmacy, PDM University, B’garh, India.
Received: July 26, 2017; Published: August 03, 2017
Abstract
Purpose: In present research work, MAO-B inhibitor rasagiline mesylate (RAS) was loaded in PLGA nanoparticles (PNPs) to improve its oral drug delivery.
Method: To achieve this goal, various formulation trials were generated by Box-Behnken statistical design, prepared and evaluated for entrapment efficiency (EE), particle size (PS) and drug release (DR). These responses were analyzed in terms of statistical which indicate significance of each factor and their best optimum level by using ANOVA.
Result: Optimization studies revealed most significant factor for PNPs and the best combination of A, B & C factor levels for optimized formulation (Fopt) was found to be -1, +1 & +1 respectively. Fopt has shown good EE & PS with well defined, smooth surface particles. The drug was transformed from crystalline to amorphous form when entrapped in nanoparticles, indicating better and improved physicochemical properties of drug for absorption. The Fopt has shown sustained drug release which was eight times higher than control (drug solution). Finally, the formulation was found to be stable (shelf life of 362.53) days at storage condition mentioned by ICH guidelines.
Conclusion: The RAS loaded polymeric nanoparticles were successfully and achieved significant prolonged delivery which can be consider for neurodegenerative disorder, further.
Keywords: RAS; PLGA; Design; Nanoparticles; Optimization; Drug delivery
Introduction
Parkinson’s disease (PD) is a chronic, progressive neurodegenerative disorder that affects the movement and expression up-to 3% of population in the age range over 65 years of all races. The burden of Parkinson’s disease (PD) is likely to increase in the years to come as many countries, particularly in Asia wiz face an ageing population. As such, it has been estimated that the number of individuals suffering PD in the world will double by the year 2030. Due to this increasing prevalence of PD it is essential to device a formulation which shall provide more effective management as well patient compliance with sustained effect to decrease the frequency of dosing [1-3].
FDA approved (2006) Rasagiline (RAS) is a novel, potent, irreversible and highly selective MAO-B inhibitor that provides a new option in the oral treatment of early and advanced PD [4]. RAS [5-7] is most likely to exert its primary effect in PD by MAO-B inhibition leading to slower metabolism of endogenous and exogenous dopamine thereby eventually causing symptomatic benefits. The selection of the model drug (RAS) rationale is photo stable, having low oral bioavailability (only 36%), at low dose (1mg/daily) showed almost 80% inhibition of MAO-B activity, well tolerated, safe does not produce any toxic metabolites like selegiline (e.g. amphetamine and methamphetamine) [8].
In current research objectives are fabrication of polymeric nanoparticulate [9-11] of RAS intended for oral delivery to improve bioavailability of drug by achieving optimum drug concentration in systemic circulation and provide sustained effect to inhibiting MAO-B enzymes. Therefore, in order to improve this drug therapy of PD, a modified and novel drug delivery system (polymeric nanoparticles; PNPs) [12-16] of RAS will be designed in such a manner that it can release drug for prolonged time & consequently cross BBB in order to provide better therapeutic sustained effect through oral route.
Material and Methods
RAS & Poly-(D, L-lactide-co-glycolide; PLGA) was received as a free sample from IntasPharma, Ahmedabad, India and Boehringer Ingelheim, Germany respectively. Polyvinyl alcohol (PVA), Mannitol and disodium hydrogen orthophosphate were purchased from Central Drug House Pvt. Ltd, India. Potassium dihydrogen orthophosphate were obtained from Qualigens fine chemicals, Mumbai, India.
Analytical Methodology
An analytical method of RAS was developed for its quantification [17] in phosphate buffer saline (PBS) pH 7.4 using a double beam UV Visible Spectrophotometer (JASCO V 630). A stock solution (I) of RAS was prepared by dissolving 100 mg RAS in 100 ml PBS pH 7.4 to obtain a concentration of 1000 µg/ml. Further, stock solution (II) was prepared by taking 10 ml of stock solution (I) and diluting it to 100 ml PBS pH 7.4 to obtain a concentration of 100 µg/ml. Aliquots of 2, 6 ml from stock solution (II) and 1.4, 1.8, 2.2, 2.6 ml from stock solution (I) were withdrawn respectively and volume was made up to 10 ml to get concentrations of 20, 60, 100, 140, 180, 220 and 260 µg/ml. These solutions were analyzed using UV-visible Spectrophotometer at 271 nm and absorbances were recorded. The procedure was followed in triplicate to minimize the chances of error.
An analytical method of RAS was developed for its quantification [17] in phosphate buffer saline (PBS) pH 7.4 using a double beam UV Visible Spectrophotometer (JASCO V 630). A stock solution (I) of RAS was prepared by dissolving 100 mg RAS in 100 ml PBS pH 7.4 to obtain a concentration of 1000 µg/ml. Further, stock solution (II) was prepared by taking 10 ml of stock solution (I) and diluting it to 100 ml PBS pH 7.4 to obtain a concentration of 100 µg/ml. Aliquots of 2, 6 ml from stock solution (II) and 1.4, 1.8, 2.2, 2.6 ml from stock solution (I) were withdrawn respectively and volume was made up to 10 ml to get concentrations of 20, 60, 100, 140, 180, 220 and 260 µg/ml. These solutions were analyzed using UV-visible Spectrophotometer at 271 nm and absorbances were recorded. The procedure was followed in triplicate to minimize the chances of error.
Preliminary trials
To select the factors and their experimental ranges (process variables & excipient having major influence on PNPs) beginning trials were done by characterized EE & PS. Polymer concentration (A), stabilizer concentration (B) and sonication time (C) were found to be the major factors affecting efficiency of PNPs. These factors and their ranges were fitted in factorial design to give formulations with their best possible combinations.
To select the factors and their experimental ranges (process variables & excipient having major influence on PNPs) beginning trials were done by characterized EE & PS. Polymer concentration (A), stabilizer concentration (B) and sonication time (C) were found to be the major factors affecting efficiency of PNPs. These factors and their ranges were fitted in factorial design to give formulations with their best possible combinations.
Design
A Box-Behnken design was selected for statistical optimization of formulation parameters by
investigating effects of factors on encapsulation efficiency (A), particle size (B), drug release (C) of RAS loaded nanoparticles. It was used to determine optimal condition of all factors by estimating experimental conditions having minimum variability using analysis of variance (ANOVA) (18-20). The factors for design were selected on the basis of literature and preliminary trials performed and used at three different levels. The levels of factors and responses are coded as shown in Table 1.
| Factors | Levels | |||||
| Independent | Agent | Codes | Unit | -1 (Low) | 0 (Central) | +1 (High) |
| Polymer | PLGA | A | mg | 40 | 60 | 80 |
| Stabilizer | PVA | B | % w/v | 0.6 | 0.9 | 1.2 |
| Sonication time | C | minutes | 1.0 | 3.0 | 5.0 | |
| Response | Abbreviation | Codes | Unit | Constraints | ||
| Entrapment efficiency | EE | Y1 | % | Maximize | ||
| Particle size | PS | Y2 | nm | Minimize | ||
| Drug release | DR | Y3 | % | Optimum | ||
Table 1: Design coded levels of factors and responses.
Preparation of RAS loaded PNPs
The PLGA nanoparticles (PNPs) of RAS were prepared using “Double Emulsion Method” [21]. The procedure was carried out in two stages by preparing primary and secondary emulsions. The first step i.e. primary emulsion was prepared by dissolving of drug (10 mg) in aqueous phase (1 ml) and adding it to the solution of poly-(d, l-lactide-co-glycolide) (PLGA in 4ml dichloromethane) and sonicated (5 minutes) in a probe sonicator on an ice bath for complete preparation of the emulsion of the two phases. Further, preparation of secondary emulsion was done by adding primary emulsion to a known concentration of aqueous solution (16 ml) of PVA and again sonicated for a specified amount of time on an ice bath.
The PLGA nanoparticles (PNPs) of RAS were prepared using “Double Emulsion Method” [21]. The procedure was carried out in two stages by preparing primary and secondary emulsions. The first step i.e. primary emulsion was prepared by dissolving of drug (10 mg) in aqueous phase (1 ml) and adding it to the solution of poly-(d, l-lactide-co-glycolide) (PLGA in 4ml dichloromethane) and sonicated (5 minutes) in a probe sonicator on an ice bath for complete preparation of the emulsion of the two phases. Further, preparation of secondary emulsion was done by adding primary emulsion to a known concentration of aqueous solution (16 ml) of PVA and again sonicated for a specified amount of time on an ice bath.
The following double emulsion was then kept on a magnetic stirrer at 300 rpm for 4 hrs for complete removal of organic phase. The drug loaded nanoparticles were collected after centrifugation at 13400 rpm for half an hour and lyophilized using mannitol (2.5% as cryoprotectant) and stored at 4°C. All 20 formulation trails were prepared in triplicate and evaluated for EE, PS & drug release.
Evaluation
The samples were analyzed for physicochemical interaction between drug and polymer by FT-IR analysis. The surface morphology of drug loaded PNPs was analyzed using Transmission Electron Microscopy (TEM). For TEM analysis, a drop of nanoparticles dispersion diluted with distilled water (dH2O) was negatively stained with phosphor-tungstic acid (2% w/v) and placed on a 400-mesh TEM copper grid coated with carbon film and dried at room temperature. Then, the slide was examined under transmission electron microscope using TEM CM-10 Philips, operating at 60-80 KV at different magnifications.
The samples were analyzed for physicochemical interaction between drug and polymer by FT-IR analysis. The surface morphology of drug loaded PNPs was analyzed using Transmission Electron Microscopy (TEM). For TEM analysis, a drop of nanoparticles dispersion diluted with distilled water (dH2O) was negatively stained with phosphor-tungstic acid (2% w/v) and placed on a 400-mesh TEM copper grid coated with carbon film and dried at room temperature. Then, the slide was examined under transmission electron microscope using TEM CM-10 Philips, operating at 60-80 KV at different magnifications.
EE and PS Analysis
The entrapment efficiency (EE) of drug loaded PNPs-1 to 20 (Table 2) was determined by “Indirect Method” by estimating total amount of free drug present [21-22]. In this, aqueous dispersion of drug loaded nanoparticles was centrifuged at 13400 rpm for half an hour and supernatant was withdrawn carefully without disturbing the cake left at bottom of Eppendorf.
The entrapment efficiency (EE) of drug loaded PNPs-1 to 20 (Table 2) was determined by “Indirect Method” by estimating total amount of free drug present [21-22]. In this, aqueous dispersion of drug loaded nanoparticles was centrifuged at 13400 rpm for half an hour and supernatant was withdrawn carefully without disturbing the cake left at bottom of Eppendorf.
The supernatant was diluted sufficiently and analyzed spectrophotometrically at 271 nm for estimation of free drug present in nanoparticles dispersion. The PS of all formulations of RAS loaded PNPs were determined by Photon Correlation Spectroscopy using Particle Size Analyzer (Malvern Zeta SizerNano ZS, UK). The samples were appropriately diluted with dH2O before analysis and the analysis was performed at a scattering angle of 90° and a temperature of 25°C. The total amount of drug encapsulated was calculated using below formula equation;
In vitro Release [23-24]
Preparation of dialysis Bag
The dialysis tubing was cut into small pieces of desired length and immersed & soaked in warm dH2O (250 ml) for half an hour. After that, they were immersed in sodium sulphide (0.3%, 250 ml) and boiled for 5 min. The tubings were then rinsed thoroughly with warm dH2O and immersed in sulphuric acid (2%, 250 ml) and boiled again for 5 min. The dialysis tubings were rinsed thoroughly again with fresh warm dist. H2O for 10 min to get rid of any chemical residue. Afterwards, dH2O was decanted and tubings were submerged completely in freshly prepared phosphate buffer saline (PBS pH 7.4 250 ml). The tubings were stored at 4oC till 24 hrs before use.
Release study
In vitrorelease study was performed in PBS pH 7.4 for 48 hrs over drug solution as control and nanoparticles dispersion (equivalent to 2 mg drug contained in dialysis bag was placed in a beaker containing 50 ml of fresh PBS pH 7.4 kept on a magnetic stirrer at 37°C). At fixed time 0.5, 1, 2, 4, 6, 12, 18, 24, 36 and 48 hrs intervals; 5 ml samples were withdrawn from receptor compartment and same volume of fresh PBS pH 7.4 was replaced in receptor medium immediately after each withdrawal to maintain sink condition. The samples were diluted sufficiently and analyzed using UV Visible Spectrophotometer at 271 nm.
In vitrorelease study was performed in PBS pH 7.4 for 48 hrs over drug solution as control and nanoparticles dispersion (equivalent to 2 mg drug contained in dialysis bag was placed in a beaker containing 50 ml of fresh PBS pH 7.4 kept on a magnetic stirrer at 37°C). At fixed time 0.5, 1, 2, 4, 6, 12, 18, 24, 36 and 48 hrs intervals; 5 ml samples were withdrawn from receptor compartment and same volume of fresh PBS pH 7.4 was replaced in receptor medium immediately after each withdrawal to maintain sink condition. The samples were diluted sufficiently and analyzed using UV Visible Spectrophotometer at 271 nm.
Mechanism of drug release
The drug release kinetic of was determined by fitting the release data in kinetic models; Zero, First, Higuchi order models Korsmeyer-Pappas, Hixson Crowell and assessing the line of best fit. The mechanism of drug release from formulation was investigated by incorporating 60% release data of Fopt in equations of kinetic model to calculate exponent value of n from slope of straight line graph and interpreted release mechanism.
The drug release kinetic of was determined by fitting the release data in kinetic models; Zero, First, Higuchi order models Korsmeyer-Pappas, Hixson Crowell and assessing the line of best fit. The mechanism of drug release from formulation was investigated by incorporating 60% release data of Fopt in equations of kinetic model to calculate exponent value of n from slope of straight line graph and interpreted release mechanism.
Accelerated stability studies
The stability study of optimized formulation was performed as per ICH guidelines Q1A (R2) [25-27]. The optimized formulation packed in an ambered colored tightly closed glass vial was stored at normal and accelerated storage conditions i.e. 5 ± 3°C and 25±2°C/60±5% RH respectively for two months and analyzed after specific time intervals 0, 15, 30 and 60 days for any change in physical and chemical characteristics.
The stability study of optimized formulation was performed as per ICH guidelines Q1A (R2) [25-27]. The optimized formulation packed in an ambered colored tightly closed glass vial was stored at normal and accelerated storage conditions i.e. 5 ± 3°C and 25±2°C/60±5% RH respectively for two months and analyzed after specific time intervals 0, 15, 30 and 60 days for any change in physical and chemical characteristics.
Result and Discussion
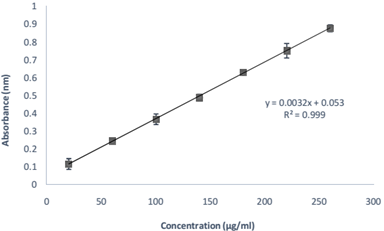
The absorption maxima (λ max) of RAS in PBS pH 7.4 was found to be 271 ± 1.0 nm and obeyed linearity between 20-240 µg/ml (Beer’s Range) with regression coefficient of 0.999 and a straight line of y=0.0039x-0.0085 (Figure 1). Another main variable (other than API) of PNPs include polymer, stabilizer and solvent system. The first two variables were selected on the basis of literature wherein PLGA was selected as a polymer due to its predictable degradation behavior, biodegradability, biocompatibility, and sustained release pattern of delivery system & ease of fabrication. The experimental range of polymer concentration was selected by evaluating the batches of PNPs prepared with different polymer concentration, maintaining all other parameters constant. Polymer concentration below 40 mg showed poor EE with small PS, whereas above 80 mg showed good EE but large PS. Therefore, 40-80 mg was selected as an experimental range of polymer concentration.
Polyvinyl alcohol (PVA) was selected as a stabilizer due to its excellent stabilizing capacity & biocompatibility. Various concentrations of polyvinyl alcohol (PVA) was tried to prepare PNPs. The EE of PNPs having less than 0.6% w/v stabilizer concentration was comparatively low due to insufficient amount of stabilizer present to encapsulate the amount of drug used. In contrast, more than 1.2% w/v of stabilizer concentration showed very low EE and PS due to presence of excess stabilizer leading to break down of intact particles into smaller fragments resulting into drug leakage. Therefore, a range of 0.6-1.2% w/v of stabilizer concentration was selected for the formulation of PNPs.
However, selection of the sonication time, batches were prepared by altering time to obtain the secondary emulsion. Significant variation in particle size was observed by taking various time limits. Sonication time less than one minutes resulted in larger PS whereas more than 5 minutes again resulted into larger PS due to agglomeration of the very small fragments of PNPs. Therefore, a limit of 1-5 min of sonication time was selected best fit to obtain PNPs of favorable PS. From preliminary trials, it could be concluded that the polymer, stabilizer concentration & sonication time critically influence the performance of PNPs and their experimental ranges were found to be 40-80 mg, 0.6-1.2% & 1-5 min respectively.
Box-Behnken Design
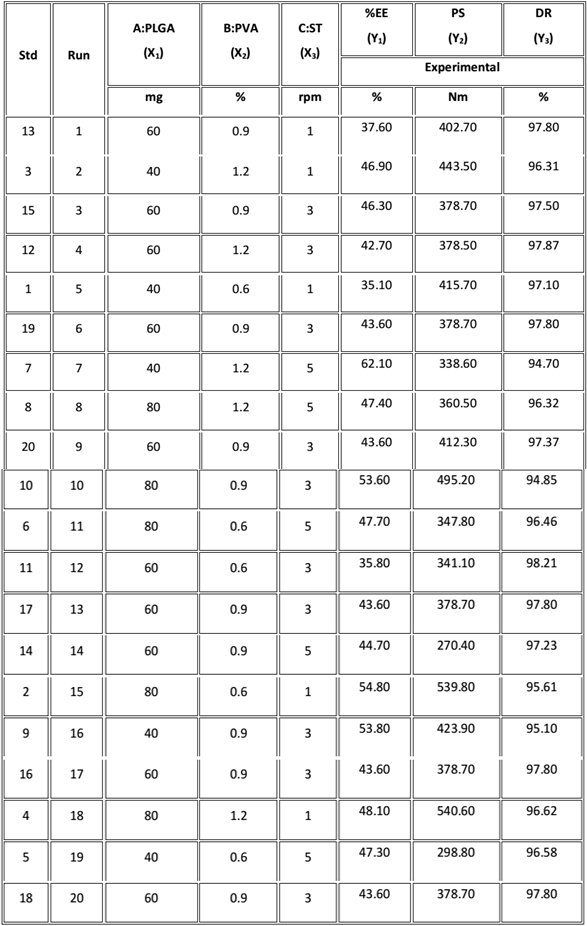
As revealed by preliminary trials, polymer, stabilizer concentration and sonication time were found to be the critical parameters for PNPs and thus, were taken into consideration as independent variables (factors) and were coded as A, B, C respectively. Total 20 experimental runs/trials (formulations) were generated by design expert with all the possible combinations of factors, as shown in Table 1. Based on design, formulations were prepared using double emulsion method and analyzed in terms of encapsulation efficiency (EE), particle size (PS) and drug release (DR) as dependent variables and were coded as Y1, Y2& Y3 respectively (Table 2).
As revealed by preliminary trials, polymer, stabilizer concentration and sonication time were found to be the critical parameters for PNPs and thus, were taken into consideration as independent variables (factors) and were coded as A, B, C respectively. Total 20 experimental runs/trials (formulations) were generated by design expert with all the possible combinations of factors, as shown in Table 1. Based on design, formulations were prepared using double emulsion method and analyzed in terms of encapsulation efficiency (EE), particle size (PS) and drug release (DR) as dependent variables and were coded as Y1, Y2& Y3 respectively (Table 2).
Data Analysis: Equations and Models
A three factor, three levels Box-Behnken statistical experimental design as the RSM requires 20 runs. The total 20 runs with triplicate center points were generated and the responses so observed are shown in (Table 2). All the responses obtained for 20 formulations prepared were simultaneously fitted to first order, second order and quadratic models using Design Expert. The best-fitted model was quadratic and the comparative values of R2, SD and %CV are given in along with the regression equation generated for each response. All statistically significant (p < 0.05) coefficients are included in the equations. A positive value represents an effect that favors the optimization, while a negative value indicates an inverse relationship between factors and the response.
A three factor, three levels Box-Behnken statistical experimental design as the RSM requires 20 runs. The total 20 runs with triplicate center points were generated and the responses so observed are shown in (Table 2). All the responses obtained for 20 formulations prepared were simultaneously fitted to first order, second order and quadratic models using Design Expert. The best-fitted model was quadratic and the comparative values of R2, SD and %CV are given in along with the regression equation generated for each response. All statistically significant (p < 0.05) coefficients are included in the equations. A positive value represents an effect that favors the optimization, while a negative value indicates an inverse relationship between factors and the response.
Polynomial equation
Response 1 (Y1): Entrapment efficiency
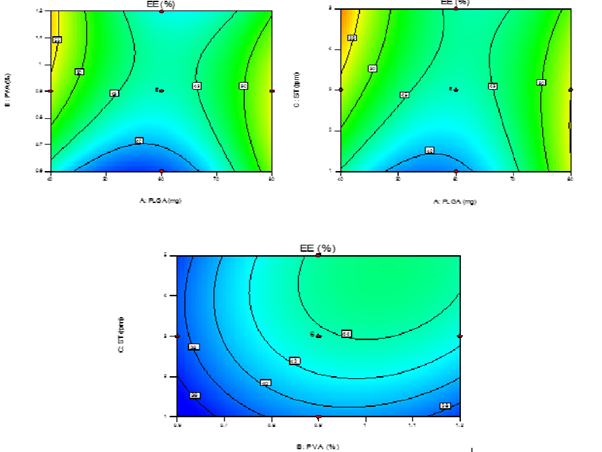
The model purports the following polynomial equation for entrapment efficiency of PNPs Y1=43.66+0.64A+2.65B+2.67-4.20AB-4.40AC-4.40BC+10.62A2-3.83B2-1.93C2 Where Y1 is the entrapment efficiency of PNPs, A is the polymer conc., B is the stabilizer conc. and C is the sonication time. The model F-value of 56.18 implies that the model is significant (p < 0.0001). The lack of fit F-value of 1.56 implies that the lack of fit is not significant. In this case X1X2, X1X3& X2X3 are significant model terms and X12 had a more pronounced effect on entrapment efficiency of PNPs than any other parameters. The predicted Rsquared of 0.8844 is in reasonable agreement with the adjusted R-squared of 0.9632. Adequate precision is within desirable limit. A ratio of 31.576 indicates an adequate signal. Therefore this model can be used to navigate the design space. The contour plots (Figure 2) which showed the effect of different independent variables on entrapment efficiency of PNPs (Y1). The EE of PNPs for all batches was found to be in the range of 35.10-62.10%.
From the experimental data it is inferred that the polymer conc. of variable A at a level
0 (60 mg), the EE was found to be more as compared to the polymer conc. at +1 level (80 mg).
An optimum level of EE was obtained at level -1. %EE is bound to increase with increase in
polymeric conc. owing to the presence of sufficient polymer in the formulation but further
increase in conc. leads to decrease in the %EE. These effects are attributed to increased
resistance against emulsification of nanoparticles in external aqueous phase due to increasing
viscosity of polymeric solution which reduces its dispersibility in aqueous phase resulting in
formation of larger particles. It leads to formation of particles having higher EE due to low
diffusion of drug from polymeric solution to external phase. But after certain level, encapsulation
reduces with polymer concentration due to increase in intrinsic viscosity of polymeric solution
during double emulsification which restricts diffusion of solvent towards the non-solvent i.e.
external phase.
As for the effect of stabilizer conc. (B) on the EE; was found to be
optimum on level +1 (1.2%). Though the effects were very unpredictable i.e. increasing
stabilizer conc. resulted in either increase or decrease in EE. The effect is attributed to presence
of insufficient stabilizer available to stabilize nanoparticles formed at very low conc. thus,
forming aggregates and encapsulating high drug concentration. In contrast, at high stabilizer
conc., small size nanoparticles are produced with low EE due to reduced interfacial tension
between particles caused by stabilizer adsorbed at surface of particles. Sonication time (C) was
found to have an inverse relationship with entrapment efficiency of PNPs.
Response 2 (Y2): Particle size
The following polynomial equation was projected by the model for particle size of the PNPs.
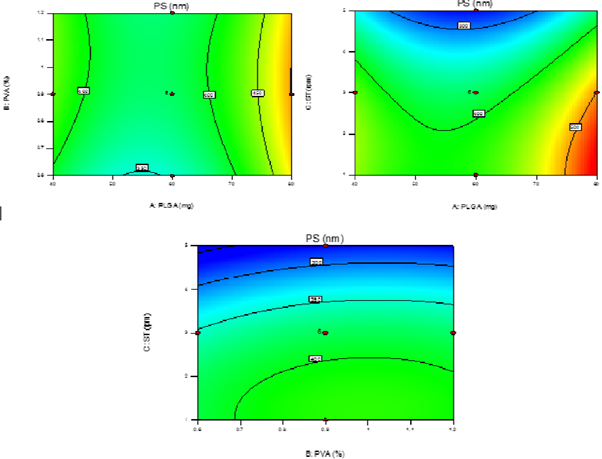
Y2=380.90+36.34A+11.85B-72.62C-6.76AB-18.79AC+2.99BC+83.75A2-16.00B2-39.25C2 Where Y2 is the particle size of the PNPs.; the negative coefficients for the sonication time show that the particlesize decreased with increase in sonication time. In totality, the model is significant (F-value = 71.85; p < 0.0001). The lack of fit is 0.49 not significant relative to pure error. The predicted R-square of 0.9572 is in reasonable agreement with the adjusted R-square of 0.9711; i.e. the difference is less than 0.2. Adequate Precision measures of 32.272 indicate it’s an adequate signal. It was observed that response Y2 i.e. PS was significantly affected by altering the polymeric conc. (A; Figure 3 showed the effect of different independent variables on PS).
There was a remarked increase in PS with increasing polymer conc. This was
probably caused by the increasing viscosity of dispersed phase (organic phase), resulting a low
dispersibility of PLGA solution into aqueous phase. Increase in polymer conc. leads to increase
in the viscous forces resisting the droplet breakdown by sonication. These forces oppose the
shear stresses in the organic phase and the final size of particle depends on the net shear stress,
which is available for droplet breakdown, therefore, level -1 (40 mg) was found optimum for
smaller PS. For a better stabilization (B), the surfactant molecules must cover the
organic/aqueous interfacial area of all the droplets.
It was observed that, as the concentration of
stabilizer was increased, the size of PNPs first decrease then increased due to increased viscosity of the medium as already discussed. So the size decreased due to the enhanced interfacial stabilization while it increases due to the increased aqueous phase viscosity. Therefore optimum amount of conc. plays an important role, which was found to be level 1 (1.2%). Reverse effect was observed for sonication time, particle size decreased with increase in sonication time (C) i.e. level 1 (5 min)
stabilizer was increased, the size of PNPs first decrease then increased due to increased viscosity of the medium as already discussed. So the size decreased due to the enhanced interfacial stabilization while it increases due to the increased aqueous phase viscosity. Therefore optimum amount of conc. plays an important role, which was found to be level 1 (1.2%). Reverse effect was observed for sonication time, particle size decreased with increase in sonication time (C) i.e. level 1 (5 min)
Response 3 (Y3): Drug Release
The model proposed constant, the regression coefficients and the statistical parameters for each
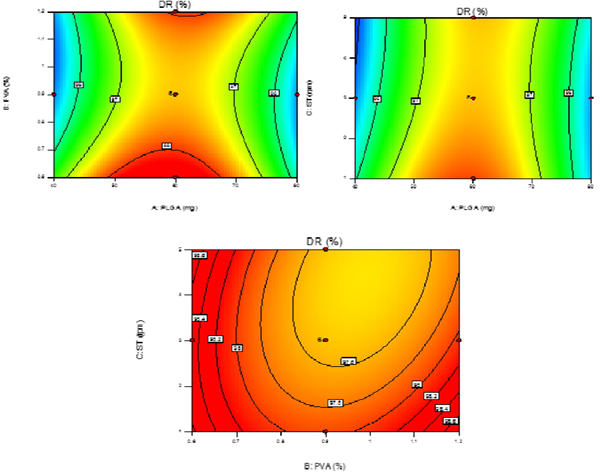
response variable, as follows: Y3=97.53+7.000E-003A-0.21B-0.22C+0.44AB+0.34AC-0.28BC-2.33A2+0.74B2+0.21C2; Where Y3 is the drug release from PNPs. This model was found to be significant (F-value = 33.49; p < 0.0001). The lack of fit is not significant (F-value = 2.86) relative to the pure error. The predicted and adjusted R-squared values (0.8799 and 0.9390) are in reasonable agreement. Adequate precision of 20.147 indicates an adequate signal to navigate the design space. The DR of PNPs was found to be in the range of 94.70-98.21% (Figure 4) after 48 hrs of study via dialysis sac method.
It was observed (Figure 4) that entirely DR was dependent on the proper formulation and intact formation of PNPs as well as the amount of drug encapsulated. The effect of polymer conc. (A) was found to be critical as the polymer degradation is the major factor affecting the intact formation of PNPs. Increase in PLGA content directly affected the polymer degradation resulted in increase in DR, thus, level -1 (40 mg) showed significant DR and sustained effect. As for the factors B & C which were more of inter-related in affecting DR of the PNPs, it was observed that higher range of level +1 (1.2%) and level +1 (5 min) of B & C produced slower DR which was due to the fact that smaller size PNPs had higher surface area resulting in increased DR. Moreover, smaller sized PNPs have more surface-associated PVA which presents a significant barrier to the outward diffusion.
Models & Validation
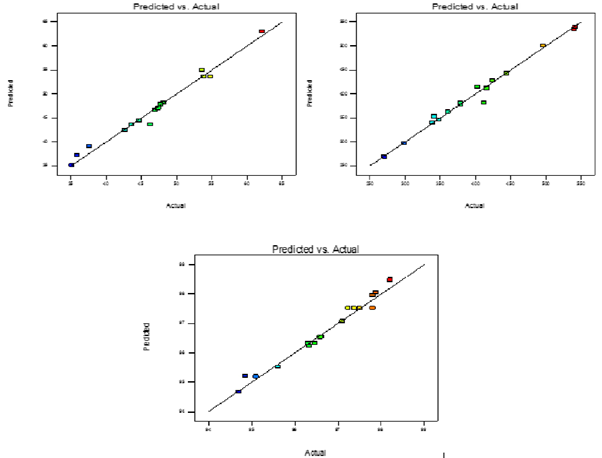
Two dimensional contour plots were prepared for all the three responses shown in (Figure 2, 3 & 4) on Y1, Y2 & Y3. These plots are used for studying the interaction effects of the factors on the responses as well as are useful in studying the effects of two factors on the response at one time. For validation of RSM results, the experimental values of the response were compared with the anticipated values. The linear correlation plots drawn between the predicted and experimental values demonstrated high values of R2 for all three responses. The R2 value (Table3) for response Y1, Y2 and Y3 was observed to be 0.9806, 0.9848, and 0.9679, respectively. It indicates excellent goodness of fit at p < 0.0001. Thus, the low magnitudes of error as well as the significant values of R2 in the present investigation prove the high predictive ability of the RSM. The plots between actual and predicted value are shown in (Figure 5).
Two dimensional contour plots were prepared for all the three responses shown in (Figure 2, 3 & 4) on Y1, Y2 & Y3. These plots are used for studying the interaction effects of the factors on the responses as well as are useful in studying the effects of two factors on the response at one time. For validation of RSM results, the experimental values of the response were compared with the anticipated values. The linear correlation plots drawn between the predicted and experimental values demonstrated high values of R2 for all three responses. The R2 value (Table3) for response Y1, Y2 and Y3 was observed to be 0.9806, 0.9848, and 0.9679, respectively. It indicates excellent goodness of fit at p < 0.0001. Thus, the low magnitudes of error as well as the significant values of R2 in the present investigation prove the high predictive ability of the RSM. The plots between actual and predicted value are shown in (Figure 5).
Optimization
From the above discussion it is clear that, best results were concluded with consideration of all the levels of factors and relating them with the response so generated. The optimized formulation was selected on the basis of independent variable i.e. %EE, PS and DR, obtained for all 20 trials. When the values of all the above mentioned factors were compared, trial number 7 obtained the most appropriate results and hence was selected as optimized formulation
From the above discussion it is clear that, best results were concluded with consideration of all the levels of factors and relating them with the response so generated. The optimized formulation was selected on the basis of independent variable i.e. %EE, PS and DR, obtained for all 20 trials. When the values of all the above mentioned factors were compared, trial number 7 obtained the most appropriate results and hence was selected as optimized formulation
Characterization of Optimized Formulation (Fopt)
Morphology
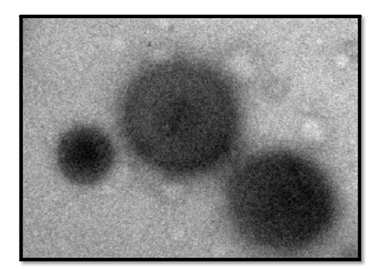
The TEM analysis of Fopt showed formation of homogenous, smooth, spherical and well-formed nanoparticles. No aggregation was observed between particles, indicating their integrity as discrete entities. Therefore, it could be concluded that the integrity of PNPs formed by double emulsion were good indicating suitability of method for preparation of PNPs.
EE, PS and Zeta potential
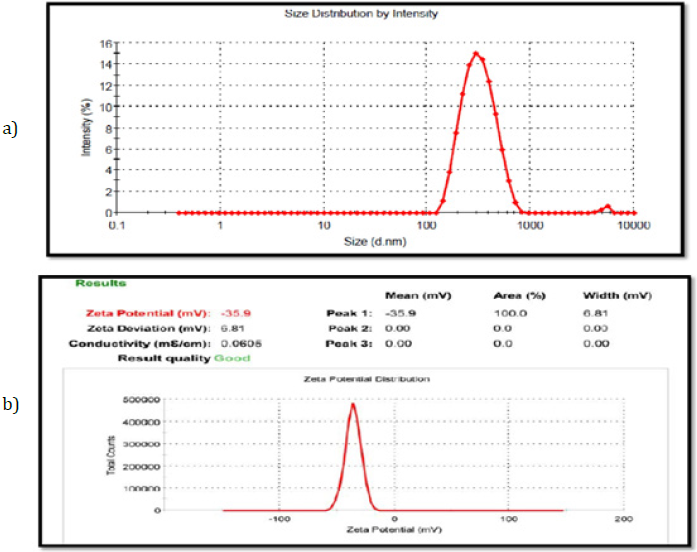
The encapsulation efficiency (EE) of Fopt was determined by “indirect method” and was found to be 62.10 ± 1.1. The particle size (PS) and polydispersity index (PDI) of Fopt determined by Particle size analyzer (Malvern Zeta SizerNano ZS, UK) as depicted from (Figure 7a). The PS of Fopt was found to be 338.60 ± 13 nm with PDI of 0.191 (observed range 0.193 to 0.187), indicating a narrow size distribution and good homogeneity of PNPs. As depicted from (Figure 7b) the zeta potential of Fopt was found to be -35.9 (observed range was -34.8 to -37.1), indicating better physical stability of formulation as particles with ζ-potential more than +30 mV and lower than -30 mV are considered to be stable.
The encapsulation efficiency (EE) of Fopt was determined by “indirect method” and was found to be 62.10 ± 1.1. The particle size (PS) and polydispersity index (PDI) of Fopt determined by Particle size analyzer (Malvern Zeta SizerNano ZS, UK) as depicted from (Figure 7a). The PS of Fopt was found to be 338.60 ± 13 nm with PDI of 0.191 (observed range 0.193 to 0.187), indicating a narrow size distribution and good homogeneity of PNPs. As depicted from (Figure 7b) the zeta potential of Fopt was found to be -35.9 (observed range was -34.8 to -37.1), indicating better physical stability of formulation as particles with ζ-potential more than +30 mV and lower than -30 mV are considered to be stable.
The higher stability of nanoparticles at high zeta potential value is attributed to presence of high surface charge. It reduces the chances of agglomeration due to electrostatic repulsion between particles bearing same electric charges and makes the system stable for longer time which is easy to redisperse. A high zeta potential also shows better absorption via Peyer’s patches and their uptake by liver for more sustained effect.
Release and Kinetics studies
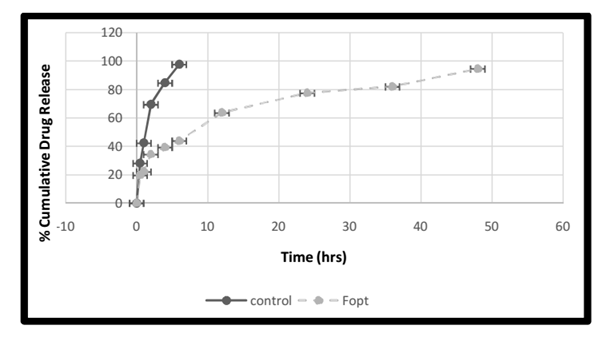
The in vitro drug release profile of control (drug solution) was rapid, consistent and completed within 6 hrs (97.78 ± 1.55%) whereas Fopt showed a sustained release profile (94.70 ± 0.28%) for 48 hrs, indicating sustained release behavior of PNPs over free drug. The Fopt have shown biphasic release pattern of RAS, consisting of an initial burst effect of 6 hrs followed by a sustained release phase up to 48 hrs (Figure 8). The initial burst effect is characterized by 43.97 ± 1.22% release of drug within 6 hrs, attributed to dissolution and diffusion of drug adhered on or located near the surface of PNPs or entrapped poorly in polymer matrix.
The in vitro drug release profile of control (drug solution) was rapid, consistent and completed within 6 hrs (97.78 ± 1.55%) whereas Fopt showed a sustained release profile (94.70 ± 0.28%) for 48 hrs, indicating sustained release behavior of PNPs over free drug. The Fopt have shown biphasic release pattern of RAS, consisting of an initial burst effect of 6 hrs followed by a sustained release phase up to 48 hrs (Figure 8). The initial burst effect is characterized by 43.97 ± 1.22% release of drug within 6 hrs, attributed to dissolution and diffusion of drug adhered on or located near the surface of PNPs or entrapped poorly in polymer matrix.
It was followed by sustained release profile (94.70 ± 0.28%) of drug for 48 hrs due to diffusion of drug located within polymer core of nanoparticles. However, the burst effect is considered to be beneficial for RAS loaded PNPs as it helps in achieving therapeutic concentration of drug in very less time to produce quick action & thereby, relieving the pathological condition quickly. The burst effect is followed by a constant release phase which helps in maintaining concentration of drug in therapeutic window for longer duration of time. It could be concluded that PLGA nanoparticles are efficient sustained release carrier for RAS. The drug release mechanism was best explained by Korsmeyer-Peppas release model with regression coefficient of 0.9873. The n-value obtained for Fopt using Korsmeyer-Peppas equation was found to be 0.3531. It indicates that the formulation followed “Non-Fickian Diffusion Transport” mechanism of drug release of controlled drug release.
Stability studies
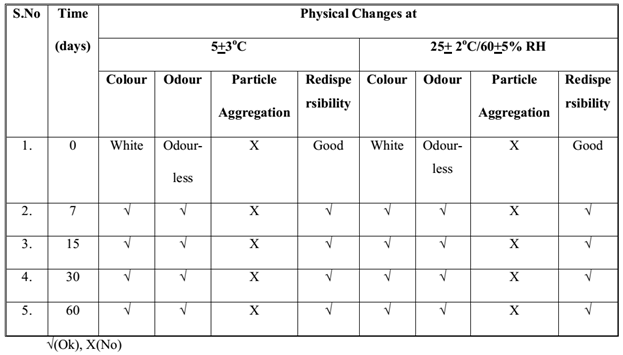
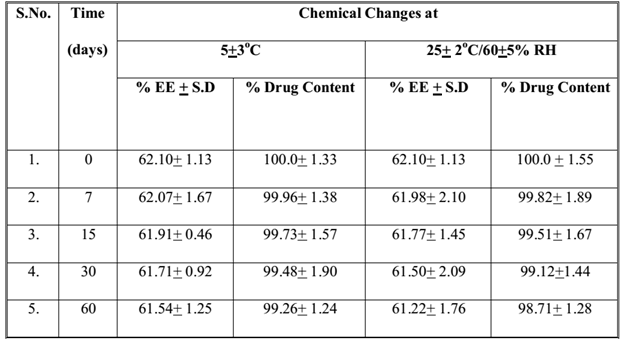
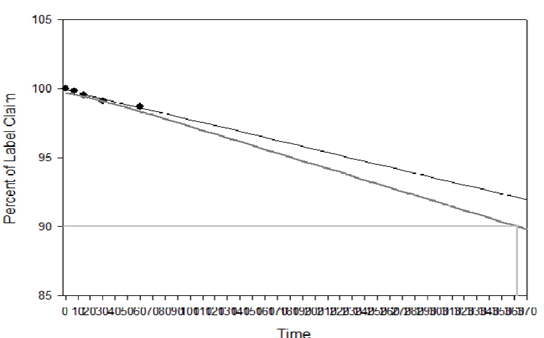
The samples of Fopt at both storage conditions were observed for physical changes at specific time interval during stability studies and results are summarized in Table 4. No physical change was observed in Fopt during stability study at normal and accelerated storage conditions of temperature and humidity, indicating good physical stability of formulation in terms of color, odour, particle aggregation and redispersibility of nanoparticles in water. Moreover, the Fopt was observed for chemical changes in terms of encapsulation efficiency and drug content at accelerated storage conditions and results are summarized in Table 5. The change in drug content observed at accelerated storage conditions i.e. 25+2°C/60+5% RH was plotted against time using software, Sigma Plot 13.0; calculated shelf life of Fopt was found to be 362.53 (Figure 9).
The samples of Fopt at both storage conditions were observed for physical changes at specific time interval during stability studies and results are summarized in Table 4. No physical change was observed in Fopt during stability study at normal and accelerated storage conditions of temperature and humidity, indicating good physical stability of formulation in terms of color, odour, particle aggregation and redispersibility of nanoparticles in water. Moreover, the Fopt was observed for chemical changes in terms of encapsulation efficiency and drug content at accelerated storage conditions and results are summarized in Table 5. The change in drug content observed at accelerated storage conditions i.e. 25+2°C/60+5% RH was plotted against time using software, Sigma Plot 13.0; calculated shelf life of Fopt was found to be 362.53 (Figure 9).
Conclusion
Box-Behnken statistical design was used for optimization of factors with minimum number of formulation trials. The formulation trials generated by design expert were prepared and evaluated for EE, PS & DR were analyzed critically and polynomial equation was generated, which represented both the responses simultaneously. Formulation trial efficient results indicated optimal parameter for representation of EE, PS & DR which also suggests optimum level of factors was found to be factor A at -1, factor B at +1 and factor C at +1 by fitting experimental data to the statistical model. An optimized formulation (Fopt) was prepared using above combination of factors and their optimum level.
The Fopt was characterized for EE, PS, DR, PDI, zeta potential and their values were found to be 62.10 ± 1.13 %, 338.60 nm, 0.191 & -35.9 mV respectively. TEM analysis of Fopt revealed formation of spherical, smooth surfaced, well-formed nanoparticles without aggregates. The X-ray diffraction of formulation confirmed conversion of drug from crystalline to amorphous phase when dispersed in PNPs. In vitro drug release studies indicated sustained release (94.70 ± 0.28% in 48 hrs) behavior of Fopt compared to control (free drug solution) where drug release (97.78 ± 1.55% release) was rapid and completed within 6 hrs. The stable biodegradable polymeric nanoparticles of Rasagiline Mesylate were productively prepared by double emulsion method for significant antiparkinsonsian activity for neurodegenerative disorder with targeted action for drug delivery.
Conflict of Interest
None to declare
None to declare
Acknowledgements
The authors are grateful and thankful to Chairman and Management of PDMREA, PDM University; P. D. M. College of Pharmacy, B’garh for supported & provided facilities for carried out research work.
The authors are grateful and thankful to Chairman and Management of PDMREA, PDM University; P. D. M. College of Pharmacy, B’garh for supported & provided facilities for carried out research work.
References
- Davie CA. “A review of Parkinson’s disease”. British Medical Bulletin 86.1 (2008): 109–27.
- Dauer W and Przedborski S. “Parkinson’s Disease”. Neuron 39.6 (2003): 889–909.
- Wright Willis A., et al. “Geographic and ethnic variation in Parkinson disease: A population-based study of us medicare beneficiaries”. Neuroepidemiology 34.3 (2010): 143–51.
- Riederer P and Laux G. “MAO-inhibitors in Parkinson’s disease”. Experimental Neurobiology 20.1 (2011): 1-17.
- Lecht S., et al. “Rasagiline - A novel MAO B inhibitor in Parkinson’s disease therapy”. Therapeutics and Clinical Risk Management 3.3 (2007): 467–474.
- Mittal D., et al. “Brain targeted nanoparticulate drug delivery system of rasagiline via intranasal route”. Drug Delivery 23.1 (2014): 1–10.
- Garbayo E., et al. “Drug development in parkinson’s disease: from emerging molecules to
innovative drug delivery systems”. Drug Delivery 76.3 (2003): 272-278. - Mandel S., et al. “Mechanism of neuroprotective action of the anti-Parkinson drug rasagiline and its derivatives”. Brain Research Reviews 48.2 (2005): 379–387.
- Wilczewska AZ., et al. “Nanoparticles as drug delivery
systems”. Pharmacological Reports 64.5 (2012): 1020-1037. - Marin E., et al. “Critical evaluation of biodegradable polymers used in nanodrugs”. International Journal of Nanomedicine 8 (2013):3071–3090.
- Mohanraj V., et al. “Nanoparticles – A Review”. Tropical Journal of Pharmaceutical Research 5.1 (2006): 561–573.
- Gambaryan PY., et al. “Increasing the Efficiency of Parkinson’s Disease Treatment Using a poly (lactic-co-glycolic acid) (PLGA) Based L-DOPA Delivery System”. Experimental Neurobiology 23.3 (2014): 246–252.
- Cheng C.J., et al. “A holistic approach to
targeting disease with polymeric nanoparticles”. Nature Reviews. Drug Discovery 14.4 (2015): 239–247. - Pahuja R., et al. “Trans-blood brain barrier delivery of dopamine-loaded nanoparticles reverses functional deficits in parkinsonian rats”. ACS Nano 9.5 (2015): 4850–4871.
- Muthu M.S and Singh S. “Studies on biodegradable polymeric nanoparticles of risperidone: in vitro and in vivo evaluation”. Nanomedicine 3.3 (2008): 305–319.
- Esteves M., et al. “Retionic acid-loaded polymeric nanoparticles induce
neuroprotection in a mouse model for Parkinson’s disease”. Neuroscience 3.7 (2015): 1-10. - Bukka R and Karwa P. ”UV Spectrophotometric Method for the Determination of Rasagiline
Mesylate”. 5.1 (2010): 5–7. - Acharya S., et al. “Optimization of size controlled poly (lactide-coglycolic acid) nanoparticles using quality by design concept”. Asian Journal of Pharmaceutics 9.3 (2015): 152.
- Aslan N and Cebeci Y. “Application of Box-Behnken design and response surface methodology for modeling of some Turkish coals”. Fuel – Journal 86.1-2 (2007): 90–97.
- Gajra B., et al. “Formulation and optimization of itraconazole polymeric lipid hybrid nanoparticles (Lipomer) using box behnken design”. DARU Journal of Pharmaceutical Sciences 23.3 (2015): 1–15.
- Bohrey S., et al. “Polymeric nanoparticles containing diazepam:
preparation , optimization , characterization , in - vitro drug release and release kinetic study”. Nano Convergence 3.1 (2016): 3–9. - Kumar A and Sawant K. “Encapsulation of exemestane in polycaprolactone nanoparticles: Optimization, characterization, and release kinetics”. Cancer Nanotechnology 4.4-5 (2013): 57–71.
- Singhvi G and Singh M. “Review: In vitrodrug release characterization models”. International Journal of Pharmaaceutical studies and Research 2.1 (2011): 77-84.
- Barzegar-Jalali M., et al. “Kinetic Analysis of Drug Release from Nanoparticles”. Journal of Pharmaceutical Sciences 11.1 (2008): 167-177.
- ICH Guidelines Q1A (R2), Guidance for Industry Q1A (R2) Stability Testing of New Drug Substances and Products, November 2003, Revision 2.
- Puthli S and Vavia PR. “Stability Studies of Microparticulate System with Piroxicam as Model Drug”. AAPS PharmSciTech 10.3 (2009): 872-880.
- Patel PN., et al. “Development and testing of novel temoxifen citrate loaded chitosan nanoparticles using ionic gelation method”. Der Pharmacia Sinica 2.4 (2011): 17-25
Citation:
Vikash Kumar., et al. “Rasagiline-Loaded PLGA Nanoparticles: Design and Evaluation”. Chronicles of Pharmaceutical Science
1.3 (2017): 160-173.
Copyright: © 2017 Vikash Kumar., et al. This is an open-access article distributed under the terms of the Creative Commons Attribution License, which permits unrestricted use, distribution, and reproduction in any medium, provided the original author and source are credited.



 Scientia Ricerca is licensed and content of this site is available under a Creative Commons Attribution 4.0 International License.