
Member In


Recommended Journals

Ophthalmology and Vision Science

Oral Health and Dentistry

Orthopaedic Surgery and Traumatology

Nutrition and Food Toxicology

Gynaecology and Perinatology

Anaesthesia, Critical Care and Pain Management

Holistic Approaches in Oncotherapy

Current Opinions in Neurological Science

Therapeutic Advances in Cardiology

Multidisciplinary Advances inVeterinary Science

Chronicles of Pharmaceutical Science

Innovative Techniques in Agriculture

Clinical Biotechnology and Microbiology

Pulmonology Research and Respiratory Care

Chronicle of Medicine and Surgery

Archives of Endocrinology and Diabetes Care

Bulletin of Clinical Immunology

Medical Research and Clinical Case Reports
Research Article
Volume 2 Issue 2 - 2018
Bioequivalence Study of Phenoxybenzamine Capsules 10 mg in Healthy Volunteers under Fasting Conditions
1Clinical Pharmacology Department, APL Research Centre, Aurobindo Pharma Ltd, Survey no.313, Bachupally, Hyderabad, Telangana, India
2Clinical Operations, Axis Clinicals Latina, Mexico
2Clinical Operations, Axis Clinicals Latina, Mexico
*Corresponding Author: Akula Thukaram Bapuji, Clinical Pharmacology Department, APL Research Centre, Aurobindo Pharma Ltd, Survey no.313, Bachupally, Hyderabad, Telangana, India.
Received: April 05, 2018; Published: April 17, 2018
Abstract
Background: Phenoxybenzamine hydrochloride is a long-acting, adrenergic, alpha-receptor-blocking agent, which can produce and maintain “chemical sympathectomy” by oral administration. It increases blood flow to the skin, mucosa and abdominal viscera, and lowers both supine and erect blood pressures. It has no effect on the parasympathetic system. Twenty to thirty percent of orally administered phenoxybenzamine appears to be absorbed in the active form. Phenoxybenzamine hydrochloride is indicated in the treatment of pheochromocytoma, to control episodes of hypertension and sweating. If tachycardia is excessive, it may be necessary to use a beta-blocking agent concomitantly; however pharmacokinetic and bioequivalence data of Phenoxybenzamine hydrochloride in healthy volunteers is not available.
Objective: This study was designed to evaluate the bioequivalence of Phenoxybenzamine hydrochloride Capsules 10 mg manufactured by Aurobindo Pharma Ltd, India with Dibenzyline (Phenoxybenzamine Hydrochloride) USP 10 mg (Reference) of Concordia Pharmaceuticals Inc., USA in healthy volunteers. This study compared dissolution profiles, relative bioavailability, pharmacokinetics, safety and tolerability of Phenoxybenzamine hydrochloride Capsules manufactured by Aurobindo Pharma Ltd, India with that of Dibenzyline (Phenoxybenzamine Hydrochloride) USP 10 mg (Reference) of Concordia Pharmaceuticals Inc., USA.
Methods: To evaluate the pharmaceutical equivalence of the test and reference products, in vitro dissolution test was performed using the US Pharmacopeia (USP) dissolution apparatus-I, basket method and a simple model independent approach using the difference factor (f1) and the similarity factor (f2) was adopted to compare dissolution profiles. A single oral 10-mg dose of the 2 formulations was administered to 12 healthy volunteers under fasting conditions in a randomized, open-label, 2-treatment, 2-sequence, 2-period crossover study with washout period of 14 days. Phenoxybenzamine plasma concentrations were quantified using a validated LC-MS/MS detection method and were used to determine the pharmacokinetic parameters. As mandated by the US Food and Drug Administration, the test and reference formulations were considered bioequivalent if the T/R ratios and 90% CI’s of the geometric mean ratios for the log-transformed values of pharmacokinetic parameters were within the predetermined range of 80.00 to 125.00.
Results: When subjected to a simple model independent approach of dissolution profile comparison, f1 (difference) and f2 (similarity factor) were found to be 1.93 and 82.84 respectively. Similarly, both test and reference formulations of Phenoxybenzamine Hydrochloride) USP 10 mg were safe and well tolerated by all the volunteers. The T/R ratios (90% CI’s) for the ratios of Cmax, AUC0-t and AUC0-inf respectively were 110.29 (88.37 - 137.65), 99.70 (80.33 - 123.75) and 99.93 (80.48 - 124.09).
Conclusion: The results of this single-dose fasting study showed that test formulation developed by Aurobindo Pharma Ltd, India was found to be predictive bioequivalent to reference formulation in healthy volunteers. Both test and reference formulations were safe and well tolerated.
Keywords: Phenoxybenzamine hydrochloride; Bioequivalence; LC-MS/MS detection method; Human plasma Pharmacokinetics; Safety
Abbreviations: BMI: Body mass index; CI: Confidence Intervals; AUC: Area under the curve
Introduction
Phenoxybenzamine [Dibenzyline is (N-(2-Chloroethyl)-N-(1-methyl-2-phenoxyethyl) benzylamine hydrochloride, is a long-acting, adrenergic, alpha-receptor blocking agent, which can produce and maintain “chemical sympathectomy” by oral administration. It increases blood flow to the skin, mucosa and abdominal viscera, and lowers 27 both supine and erect blood pressures. It has no effect on the parasympathetic system [1]. Phenoxybenzamine is indicated in the treatment of pheochromocytoma, to control episodes of hypertension and sweating. If tachycardia is excessive, it may be necessary to use a beta-blocking agent concomitantly [1]. Phenoxybenzamine produces its therapeutic actions by blocking alpha receptors, leading to a muscle relaxation and a widening of the blood vessels. This widening of the blood vessels results in a lowering of blood pressure. [2]. Phenoxybenzamine (PBZ), administered in doses up to 20 mg/day, caused aspermia following male orgasm. This led to the development of a male contraceptive pill, PBZ being the active drug. [3]. Phenoxybenzamine irreversibly binds to the α-receptors, lowering peripheral resistance and increasing cardiac output.
The usual oral dose of phenoxybenzamine for pheochromocytoma is 10 mg twice daily, gradually increasing every other day to doses ranging between 20 and 40 mg two or three times a day. [4] The initial dosage is 10 mg once or twice daily, and the dose is increased by 10 to 20 mg in divided doses every 2 to 3 days as needed to control blood pressure and spells. The final dosage of phenoxybenzamine is typically between 20 and 100 mg daily. [5] Phenoxybenzamine was licensed in January 1982 in the USA and subsequently in European Union in February 1994.
Bioequivalence means comparison of pharmacokinetics of two different formulations which are expected to show similar in vivo response i.e. similar in terms of safety and efficacy.
Two formulations are said to be bioequivalent if they exhibit similar rate and extent of absorption assessed by means of pharmacokinetic parameters Cmax & AUC derived from plasma concentration time curve when administered in same molar dose.
Bioequivalence can be established through various methods, including in-vivo and in-vitro methods; however, the pharmacokinetic approach is the most commonly used method. The reason might be that the primary aim of bioequivalence studies is to assess the rate and extent of drug absorption, which can be readily assessed by key pharmacokinetic parameters such as Cmax, Tmax, AUC, and t1/2. [6,7]
Currently pharmacokinetic and bioequivalence data of Phenoxybenzamine hydrochloride Capsules 10 mg in healthy volunteers is not available. This study compared the relative bioavailability and pharmacokinetics of test formulation (Phenoxybenzamine hydrochloride Capsules) developed by Aurobindo Pharma Ltd, India with that of reference formulation [Dibenzyline (Phenoxybenzamine Hydrochloride) Capsules USP 10 mg] of Concordia Pharmaceuticals Inc., USA in healthy mexican volunteers under fasting conditions.
Methods
Formulations: The reference formulation and test formulation of Phenoxybenzamine hydrochloride were 10 mg Capsules. The test formulation is Phenoxybenzamine hydrochloride Capsules manufactured by Aurobindo Pharma Ltd, India. The reference formulation is Dibenzyline (Phenoxybenzamine Hydrochloride) Capsules USP 10 mg manufactured for Concordia Pharmaceuticals Inc., USA. Each capsule of test formulation contains Phenoxybenzamine Hydrochloride USP 10 mg. Each capsule of reference formulation contains Phenoxybenzamine Hydrochloride 10 mg.
Assay and In Vitro Dissolution Studies
To evaluate the pharmaceutical equivalence of the test and reference products, dissolution test was performed using the US Pharmacopeia (USP) dissolution apparatus-II, paddle method according to the official monograph. Samples collected at various time intervals were analyzed using the RP-HPLC/UV detection method described later, and a simple model independent approach using the difference factor (f1) and the similarity factor (f2) was adopted to compare dissolution profiles. The f1 calculates the percent difference between the 2 curves at each time point and is the measure of the relative error between the 2 curves, whereas the f2 is a logarithmic reciprocal square root transformation of the sum of squared error and is the measure of the similarity in the percent of dissolution between the 2 curves. These factors were calculated using the following equations, respectively:
To evaluate the pharmaceutical equivalence of the test and reference products, dissolution test was performed using the US Pharmacopeia (USP) dissolution apparatus-II, paddle method according to the official monograph. Samples collected at various time intervals were analyzed using the RP-HPLC/UV detection method described later, and a simple model independent approach using the difference factor (f1) and the similarity factor (f2) was adopted to compare dissolution profiles. The f1 calculates the percent difference between the 2 curves at each time point and is the measure of the relative error between the 2 curves, whereas the f2 is a logarithmic reciprocal square root transformation of the sum of squared error and is the measure of the similarity in the percent of dissolution between the 2 curves. These factors were calculated using the following equations, respectively:
f1= {[St=1n |Rt-Tt|]/[St=1nRt]} x 100.
f2= 50 x log {[1+ (1/n) St=1n (Rt-Tt)2]-0.5 x 100}
f2= 50 x log {[1+ (1/n) St=1n (Rt-Tt)2]-0.5 x 100}
Where n is the number of time points, Rt is the dissolution value of the reference product at time t, and Tt is the dissolution value of the test product at time t.
Using the mean dissolution values from both curves at each time interval, f1 and f2 were calculated using the fore mentioned equations. For curves to be considered similar, f1 values should be close to 0, and f2 values should be close to 100. Generally, f1 values up to 15 (0–15) and f2 values ≥ 50 (50–100) ensure sameness or equivalence of the 2 curves and, thus, of the performance of the 2 products.
Volunteers: This study was conducted according to the principles of the Declaration of Helsinki and its amendments. The study protocol was approved by the Ethical Committee of the AXIS CLINICALS LATINA S.A. de C.V, Ing. Basiliso Romo Anguiano No. 225Col. Guadalupe Insurgentes, Ciudad de México, C.P. 07870.The study objectives and the effects of drugs used in the study were explained to volunteers at the start of the study, and informed consent was obtained. Study volunteers were also compensated financially.
Healthy adult male and female Mexican volunteers aged between 18 and 55 years were recruited for this study. A detailed medical history was obtained and a clinical examination was performed for all volunteers at the beginning of the study under the supervision of a qualified physician. In addition, 12-lead electrocardiography, complete blood count, blood pressure, blood sugar level, liver function tests, lipid profile, and renal function tests were also carried out in all study volunteers. Volunteers were confirmed with negative test result of alcoholometry respiratory income of each period prior to the administration of Phenoxybenzamine formulations. All the Subjects were within the BMI ranging from 18 to 25 kg/m2. Participating women should not be pregnant or lactating. They must sign a letter of commitment of being not pregnant (since the signing of informed consent).
| No. Vol. | Gender | Age (years) | Weight (kg) | Height (m) | BMI (kg/m2) |
| 01 | Male | 41 | 66.4 | 1.72 | 22.4 |
| 02 | Male | 38 | 54.4 | 1.71 | 18.6 |
| 03 | Female | 20 | 55.5 | 1.66 | 20.2 |
| 04 | Male | 21 | 53.2 | 1.67 | 19.1 |
| 05 | Female | 20 | 63.2 | 1.71 | 21.6 |
| 06 | Male | 19 | 66.0 | 1.86 | 19.1 |
| 07 | Female | 32 | 57.5 | 1.52 | 24.9 |
| 08 | Female | 24 | 57.5 | 1.58 | 23.0 |
| 09 | Male | 23 | 63.6 | 1.61 | 24.5 |
| 10 | Male | 40 | 57.1 | 1.68 | 20.2 |
| 11 | Female | 25 | 64.8 | 1.63 | 24.4 |
| 12 | Male | 30 | 69.7 | 1.70 | 24.1 |
| Average | 27.75 | 60.74 | 1.67 | 21.84 | |
| Standard Deviation | 8.20 | 5.47 | 0.08 | 2.35 | |
| Minimum | 19.00 | 53.20 | 1.52 | 18.60 | |
| Maximum | 41.00 | 69.70 | 1.86 | 24.90 | |
| % CV | 29.56 | 9.01 | 5.06 | 10.76 | |
| Subjects by gender: | Male | 07 | |||
| Female | 05 | ||||
Table 1: Demographical data of the volunteers who participated in the clinical study.
Volunteers with a history of hypersensitivity to study drug or any other drugs belonging to the same therapeutic group and history of bronchial asthma were excluded. Volunteers with recent history of drug abuse, including alcohol and with a history or physical examination evidence of gastrointestinal disease, kidney, liver, endocrine, respiratory, cardiovascular, dermatological or hematological clinically significant were also excluded from the study. Volunteers who had taken potentially toxic drugs within 30 days before the start of the study and who have taken any medication within 14 days or 7 half-lives thereof, prior to the start of the study were also excluded. Volunteers who have donated or lost 450 mL or more of blood within 60 days prior to study and who consumed grapefruit juice or drinks, or spicy foods in the 10 hours prior to admission of the study drug were also excluded from the study.
| Study Period | Group | Phenoxybenzamine hydrochloride Formulation Administered |
| First Period | 1 | One Capsule of Phenoxybenzamine hydrochloride (Reference formulation) |
| 2 | One Capsule of Phenoxybenzamine hydrochloride (Test formulation) | |
| 2 weeks washout period | ||
| Second Period | 1 | One Capsule of Phenoxybenzamine hydrochloride (Test formulation) |
| 2 | One Capsule of Phenoxybenzamine hydrochloride (Reference formulation) | |
Table 2: Study Design for Bioequivalence Evaluation of Test and Reference Formulations of Phenoxybenzamine hydrochloride Capsules..
Study Design and Drug Administration
Various bioequivalence parameters of the 2 products were assessed under fasting conditions in a randomized, open-labeled, balanced, 2-treatment, 2-sequence, 2-period, single-dose, crossover study with a 2-week washout period at the AXIS CLINICALS LATINA S.A. de C.V, Ing. Basiliso Romo Anguiano No. 225Col. Guadalupe Insurgentes, Ciudad de México, C.P. 07870 after obtaining approval from REC (Research and Ethics Committee), Mexico & COFEPRIS (Federal Commission for the Protection Against Sanitary Risks) with authorization number 173300410B0473/2017.
Various bioequivalence parameters of the 2 products were assessed under fasting conditions in a randomized, open-labeled, balanced, 2-treatment, 2-sequence, 2-period, single-dose, crossover study with a 2-week washout period at the AXIS CLINICALS LATINA S.A. de C.V, Ing. Basiliso Romo Anguiano No. 225Col. Guadalupe Insurgentes, Ciudad de México, C.P. 07870 after obtaining approval from REC (Research and Ethics Committee), Mexico & COFEPRIS (Federal Commission for the Protection Against Sanitary Risks) with authorization number 173300410B0473/2017.
Using SAS software generated randomization schedule, volunteers were randomly divided into 2 groups (group 1 and group 2), each group consisting of 6 healthy volunteers. During the first study period, healthy volunteers from group 1 received a single oral 10-mg dose of the reference formulation, whereas healthy volunteers from group 2 received the test formulation under the supervision of Investigator. In the second study period, the order was reversed. A non-blind approach was applied; both volunteers and investigators were aware of the formulations given to each group.
Tolerability Assessment
Tolerability in volunteers was assessed before medication administration and at 0.00, 3.00, 8.00 and 16.00 hours during the study through physical examination, monitoring vital signs (temperature, blood pressure, heart rate, and respiratory rate) and interviewing them about adverse events that may be associated with the use of Phenoxybenzamine (eg, headache, nausea, vomiting, Postural hypotension, tachycardia, inhibition of ejaculation, nasal congestion and miosis) under the supervision of a qualified physician.
Tolerability in volunteers was assessed before medication administration and at 0.00, 3.00, 8.00 and 16.00 hours during the study through physical examination, monitoring vital signs (temperature, blood pressure, heart rate, and respiratory rate) and interviewing them about adverse events that may be associated with the use of Phenoxybenzamine (eg, headache, nausea, vomiting, Postural hypotension, tachycardia, inhibition of ejaculation, nasal congestion and miosis) under the supervision of a qualified physician.
Three (03) adverse events occurred in 02 volunteers during the development of the Clinical Study and according to medical criterion, 02 of them were of mild severity and 01 of them was of moderate severity. There were no serious adverse events reported during the entire study. Both test and reference formulations were well tolerated by all the healthy volunteers in this study.
Sample Collection and Processing
Venous blood samples (6 mL) were collected at 0.00 (pre-dose in duplicate) and at 0.50, 1.00, 1.50, 2.00, 2.50, 3.00, 3.50, 4.00, 5.00, 6.00, 8.00, 10.00, 12.00, 16.00, 24.00, 36.00, 48.00 and 78.00 hours post dose, drawn by venipuncture, by placing a catheter fixed, preferably in the anterior aspect of the forearm, during internment.
Venous blood samples (6 mL) were collected at 0.00 (pre-dose in duplicate) and at 0.50, 1.00, 1.50, 2.00, 2.50, 3.00, 3.50, 4.00, 5.00, 6.00, 8.00, 10.00, 12.00, 16.00, 24.00, 36.00, 48.00 and 78.00 hours post dose, drawn by venipuncture, by placing a catheter fixed, preferably in the anterior aspect of the forearm, during internment.
At each time point, the blood samples were collected in pre-chilled, pre-labeled vacutainer tubes containing K2EDTA and pre-added 0.66 mL of 0.2 N hydrochloric acid solution (In the ratio of 100 μL of 0.2 N hydrochloric acid solution per 900 μL of blood) and mix gently; they were centrifuged to separate plasma immediately at 3500 rpm for 10 minutes, at a temperature of 4°C, and the separated plasma was transferred into Cryogenic tubes. Cryogenic tubes were frozen at -70 ± 15°C until analysis.
Analysis of Samples
Samples were analyzed by a validated LC-MS/MS method, discussed below. Phenoxybenzamine standard was received from Aurobindo Pharma Limited, India and Phenoxybenzamine-d5 standard was received from Clearsynth Labs Limited, India.
Samples were analyzed by a validated LC-MS/MS method, discussed below. Phenoxybenzamine standard was received from Aurobindo Pharma Limited, India and Phenoxybenzamine-d5 standard was received from Clearsynth Labs Limited, India.
HPLC-grade solvents such as methanol, acetonitrile were purchased from Labs can and all other chemicals and reagents such as Ammonium formate, Hydrochloric acid and Diethylamine were purchased from Merck Millipore. Deionised water was prepared using a Millipore water system. All these reagents and chemicals were used without further purification.
Solid-phase extraction was adopted for the sample preparation. At the time of analysis, the samples were thawed at room temperature and 50µl of Phenoxybenzamine-d5 solution (10000pg/mL) as the internal standard was vertex-mixed with 300 µL plasma sample for 30 seconds. Then, these samples were added with 300 uL of 0.2N Hydrochloric Acid solution and mixed. Prelabelled Plexa PCX SPE cartridges were activated with 1 mL of methanol, equilibrated with 1 mL of deionized water and loaded the plasma samples onto respective prelabelled SPE cartridges and applied positive pressure to pass the plasma samples through SPE cartridges. Then, the sample SPE cartridges were washed with 1 mL of deionized water.
The sample SPE cartridges were left drying for 2 minutes and samples are eluted with 1 mL of elution solvent (Diethylamine: Methanol – 5:95 mixture) into prelabelled collection tubes. The eluted samples were evaporated for 60 minutes at 50°C and 20 psi nitrogen gas. The residues were dissolved in 300µL mobile phase and 10 µL samples were injected to the chromatographic system.
The chromatographic separations were achieved using a Symmetry C18 analytical column (5 µm, 4.6 x 100 mm). The mobile phase consisted of Acetonitrile-5 mM Ammonium formate buffer pH 4.0 (80%:20%). The flow rate of the mobile phase was set at 1.0 ml/min. The column oven temperature was 35˚C. The autosampler temperature was 10°C.
The Shimadzu HPLC system was coupled to an API 4500 MS/MS triple-quadrupole system detector equipped with a turbo ion spray ionization (ESI) source (Applied Biosystems MDS, SCIEX, Canada). The turbo ion spray ionization source was operated in a positive mode. The ion spray voltage was adjusted to 5500 V. The mass spectrometer was operated at a unit resolution for both Q1 and Q3 in multiple reaction monitoring (MRM) mode. The transition of precursor to product ion was monitored at 341.20→ 100.10 for Phenoxybenzamine and 346.20→ 100.10 for internal standard (Phenoxybenzamine-d5).
The method had a total run time 2.5 minutes. Chromatograms processing, data generation and concentrations back calculations were all performed by the Analyst software (Applied Biosystems, MDS, SCIEX, Canada).
The chromatographic method was validated according to international guidelines to establish selectivity, accuracy, precision, recovery, calibration curve, and stability. Sample concentrations, C, were calculated using the following formula
x = y-c/m
x = y-c/m
Where,x is analyte Concentration in sample; y is ratio of analyte peak area / Internal standard peak area; m is slope of the calibration curve; and c is y-axis intercept value
Pharmacokinetics and Statistical Analyses
Plasma concentrations of Phenoxybenzamine at various time intervals following oral administration of the 2 products were determined for each volunteer and mean values were calculated. A no compartment model was used to determine the following pharmacokinetic parameters: Cmax, Tmax, AUC0–t, AUC0-inf, kel and t1/2. Cmax and Tmax were obtained directly from the concentration–time curve; AUC was calculated using the linear trapezoidal method. Elimination rate constant (ke) was calculated by applying a log-linear regression analysis to at least the last 3 quantifiable Phenoxybenzamine concentrations, and then t1/2 was calculated as 0.693/ke. All of these pharmacokinetic parameters were determined using the using the software Phoenix® WinNonlin® Version 6.4.
Plasma concentrations of Phenoxybenzamine at various time intervals following oral administration of the 2 products were determined for each volunteer and mean values were calculated. A no compartment model was used to determine the following pharmacokinetic parameters: Cmax, Tmax, AUC0–t, AUC0-inf, kel and t1/2. Cmax and Tmax were obtained directly from the concentration–time curve; AUC was calculated using the linear trapezoidal method. Elimination rate constant (ke) was calculated by applying a log-linear regression analysis to at least the last 3 quantifiable Phenoxybenzamine concentrations, and then t1/2 was calculated as 0.693/ke. All of these pharmacokinetic parameters were determined using the using the software Phoenix® WinNonlin® Version 6.4.
Pharmacokinetic data for the 2 formulations were log-transformed before statistical analysis, which was based on the 90% CIs for the ratio of the geometric means for these log-transformed pharmacokinetic parameters of the 2 formulations (test/reference).
The lower boundary (LB) and higher boundary (HB) of 90% CIs were calculated using the following equations [8]:
LB = e(MD-[t-value X SD/√n])
HB = e (MD+ [t-value X SD/√n])
Where MD is the mean difference and SD refers to the standard deviation of the transformed metric; n is the number of patients in the study.
LB = e(MD-[t-value X SD/√n])
HB = e (MD+ [t-value X SD/√n])
Where MD is the mean difference and SD refers to the standard deviation of the transformed metric; n is the number of patients in the study.
If the 90% CIs for the ratios of Cmax, AUC0–t and AUC0-inf values of the test and reference formulations fell within the range of 80.00 to 125.00, then these were considered bioequivalent, as recommended by the US FDA [9].
Results
Assay and In vitro Dissolution Studies
The mean (SD) percentage of the active ingredient in the test and reference formulations was found to be 100.2% (2%) and 102.5% (1%), respectively.
The mean (SD) percentage of the active ingredient in the test and reference formulations was found to be 100.2% (2%) and 102.5% (1%), respectively.
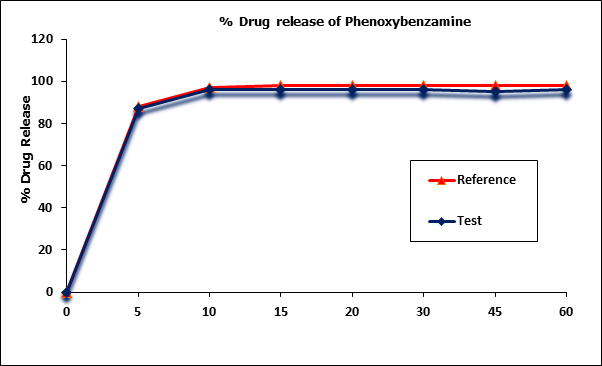
Phenoxybenzamine mean in vitro drug release (dissolution) profiles of the test and reference capsule formulations were determined (Figure I) and the data were subjected to a simple model independent approach of dissolution profile comparison. The f1 and the f2 were found to be 1.93 and 82.84, respectively (Table 2).
However since more than more than 85% of the drug is dissolved within 15 minutes, dissolution profiles of test & reference products were considered as similar.
;)
Figure 1: Phenoxybenzamine in vitro drug release profile of test and reference
formulations. Each point represents mean (SD) of 12 Capsules.
| Time (min) | Mean % Release | Difference Factor (f1) | Similarity Factor (f2) | |
| Test Formulation | Reference Formulation | |||
| 0 | 0 | 0 | 1.93 | 82.84 |
| 5 | 87 | 88 | ||
| 10 | 96 | 97 | ||
| 15 | 96 | 98 | ||
| 20 | 96 | 98 | ||
| 30 | 96 | 98 | ||
| 45 | 95 | 98 | ||
| 60 | 96 | 98 | ||
Table 3: Comparison of the dissolution profile of 2 Phenoxybenzamine Capsule formulations (n = 12, where n is the number of capsules tested of each formulation).
Tolerability
Both test and reference formulations were well tolerated by all the healthy volunteers in this study. No unexpected incidents occurred that influenced study outcomes, and all the 12 volunteers continued to study end and were discharged in good health.
Both test and reference formulations were well tolerated by all the healthy volunteers in this study. No unexpected incidents occurred that influenced study outcomes, and all the 12 volunteers continued to study end and were discharged in good health.
Validation of the Analytical Method
The LC-MS/MS method developed for the quantification of Phenoxybenzamine in plasma was linear in the range of 25.0 to 25035.8 pg/mL, where at the LLOQ accuracy obtained was 94.5% (less than 20% deviation) and 97.0%-108.8% for standard points higher than LLOQ (less than 15% deviation), and 75% ratio of total standard points were accepted. The correlation coefficients (r) of all standard curves were more than 0.9978 for plasma samples.
The LC-MS/MS method developed for the quantification of Phenoxybenzamine in plasma was linear in the range of 25.0 to 25035.8 pg/mL, where at the LLOQ accuracy obtained was 94.5% (less than 20% deviation) and 97.0%-108.8% for standard points higher than LLOQ (less than 15% deviation), and 75% ratio of total standard points were accepted. The correlation coefficients (r) of all standard curves were more than 0.9978 for plasma samples.
The lower limit of quantification was 25 pg/mL for Phenoxybenzamine in plasma. LLOQ response is identifiable, discrete and reproducible with precision and ac-curacy of ± 20%. The peak is identifiable, precise and accurate at this concentration. Specificity of the method was verified by the absence of any co-eluted peaks of endogenous plasma component at the retention times of the drug or the internal standard. All samples passed the acceptance criteria. The intra-day accuracies were 86.6% to 106.5% for LLOQ and 93.2%-106.2% for QC's above LLOQ and the inter-day accuracies were 96.1% for LLOQ and 96.7%-105.5% for QC's above LLOQ. The intra-day precision was 4.6% to 8.1% for LLOQ and 0.5%–5.2% for QC's above LLOQ. The inter-day precision was 10.4% for LLOQ and 1.9%-4.3% for QC's above LLOQ. This results support the fact that the method is accurate and precise, where deviations obtained were less than 20% for LLOQ and less than 15% for the QC's above the LLOQ. The average extraction recoveries of Phenoxybenzamine determined at 74.9, 7756.6 and 19011.3 pg/ml were 79.1%, 82.9% and 85.9% respectively, while that of internal standard (Phenoxybenzamine-d5) was 87.3% with high degree of precision, accuracy and reproducibility. Phenoxybenzamine was stable with absolute percentages of deviation of calculated vs theoretical concentration being less than 15% for auto sampler, freeze-thaw, short-term and long-term stabilities determined at two concentrations of 74.9 and 19011.3 pg/ml. The stability was within the limit of 85.0% - 115.0% & the CV% less than 15.0%
Pharmacokinetics and Statistical Analyses
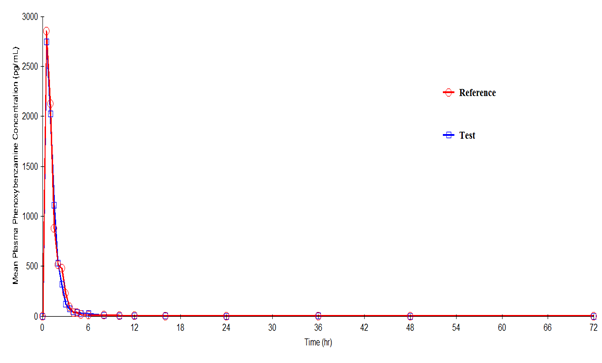
Phenoxybenzamine mean plasma concentration–time profiles after administration of the test and reference formulations in Mexican healthy volunteers are shown in Figure III. Mean (SD) values of various pharmacokinetic parameters for the test and reference formulations respectively for Cmax were 3521.7 (1660.55) and 3332.3 (1898.02) pg/mL; AUC0-t were 3639.7 (2033.42) and 3679.1 (2287.39) pg·h/mL; AUC0-inf were 3735.2 (2147.22) and 3746.5 (2343.23) pg·h/mL; t1/2 were 2.08 (3.814) and 1.54 (1.718) h; Tmax were 0.79 (0.396) and 0.79 (0.581) h; Kel were 0.7507 (0.39548) and 0.7966 (0.40714) h-1. Similarly, the 90% CIs for the ratios of Cmax, AUC0–t and AUC0-inf for the 2 formulations respectively were 88.37- 137.65, 80.33-123.75 and 80.48-124.09 which along with summary statistics such as median, range, and %CV are given in Table 4.
Phenoxybenzamine mean plasma concentration–time profiles after administration of the test and reference formulations in Mexican healthy volunteers are shown in Figure III. Mean (SD) values of various pharmacokinetic parameters for the test and reference formulations respectively for Cmax were 3521.7 (1660.55) and 3332.3 (1898.02) pg/mL; AUC0-t were 3639.7 (2033.42) and 3679.1 (2287.39) pg·h/mL; AUC0-inf were 3735.2 (2147.22) and 3746.5 (2343.23) pg·h/mL; t1/2 were 2.08 (3.814) and 1.54 (1.718) h; Tmax were 0.79 (0.396) and 0.79 (0.581) h; Kel were 0.7507 (0.39548) and 0.7966 (0.40714) h-1. Similarly, the 90% CIs for the ratios of Cmax, AUC0–t and AUC0-inf for the 2 formulations respectively were 88.37- 137.65, 80.33-123.75 and 80.48-124.09 which along with summary statistics such as median, range, and %CV are given in Table 4.
| Pharmacokinetic Parameters | Test Formulation | Reference Formulation | P value | T/R Point Estimate (90% CI) |
| Cmax (pg/mL) | ||||
| Mean (SD) | 3521.7 (1660.55) | 3332.3 (1898.02) | 0.4418 | 110.29 |
| Range | 971.3-7170.8 | 628.3-7420.3 | (88.37-137.65) | |
| Median | 3806.3 | 3094.1 | ||
| %CV | 47.15 | 56.96 | ||
| AUC0-t (hr.pg/mL) | ||||
| Mean (SD) | 3639.7 (2033.42) | 3679.1 (2287.39) | 0.9806 | 99.70 |
| Range | 968.2-7154.8 | 829.0-9033.7 | (80.33-123.75) | |
| Median | 3457.2 | 3344.2 | ||
| %CV | 55.87 | 62.17 | ||
| AUC0-inf (hr.pg/mL) | ||||
| Mean (SD) | 3735.2 (2147.22) | 3746.5 (2343.23) | 0.9956 | 99.93 |
| Range | 985.3-7805.6 | 876.1-9178.2 | (80.48-124.09) | |
| Median | 3497.4 | 3380.0 | ||
| %CV | 57.49 | 62.55 | ||
| Tmax (h) | ||||
| Mean (SD) | 0.79 (0.396) | 0.79 (0.581) | -- | -- |
| Range | 0.50-1.50 | 0.50-2.50 | ||
| Median | 0.50 | 0.50 | ||
| %CV | 50.08 | 73.28 | ||
| t1/2 (hr) | ||||
| Mean (SD) | 2.08 (3.814) | 1.54 (1.718) | -- | -- |
| Range | 0.46-14.14 | 0.54-6.13 | ||
| Median | 1.00 | 0.79 | ||
| %CV | 183.38 | 111.48 | ||
| Kel (hr-1) | ||||
| Mean (SD) | 0.7507 (0.39548) | 0.7966 (0.40714) | ||
| Range | 0.0490-1.5046 | 0.1131-1.2811 | ||
| Median | 0.7042 | 0.8795 | ||
| %CV | 52.68 | 51.11 |
Table 4: Pharmacokinetic parameters and 90% CIs for the ratios of the geometric means of their log-transformed values for the 2 Phenoxybenzamine hydrochloride capsule formulations (n = 12, where n is the number of volunteers).
Discussion
Aspects of this study design, such as use of a single dose; recruitment of healthy volunteers; fasting, standardized diet, fluid intake etc and the study conditions were consistent with the regulatory guidelines [9, 10] to bring uniformity in the testing conditions for the 2 formulations.
The mean values for Cmax, Tmax, AUC0-t, AUC0-inf, Kel and t1/2 of the 2 formulations did not differ significantly (P ≥ 0.05), suggesting that the plasma profiles generated by the test formulation were not significantly different from those produced by the reference formulation.
Based on the observed T/R ratios and 90% CI’s of Cmax, AUC0-t and AUC0-inf, it was evident that the test formulation showed similar in-vivo profile to that of reference formulation. Similarly, the in vitro dissolution studies found that the formulations were pharmaceutically equivalent with respect to dosage form.
;)
Figure 2: Plasma concentration versus time profile of Phenoxybenzamine after 10-mg oral dose of test and reference formulations. Each point represents mean (pg/mL).
Conclusions
The results of this single-dose fasting study showed that test formulation developed by Aurobindo Pharma Ltd, India was found to be predictive bioequivalent to reference formulation in healthy male and female volunteers. No statistically significant differences were found among in vitro dissolution profiles, relative bioavailability and pharmacokinetic parameters. The study also concluded that both test and reference formulations of Phenoxybenzamine hydrochloride Capsules 10 mg were safe and well tolerated.
Acknowledgments
All authors contributed equally to this study. Axis Clinicals Ltd, Mexico was selected by Aurobindo Pharma Ltd, India to design and perform this bioequivalence study and to determine whether the test formulation developed by Aurobindo is bioequivalent to reference formulation. The authors have indicated that they have no other conflicts of interest regarding the content of this article.
All authors contributed equally to this study. Axis Clinicals Ltd, Mexico was selected by Aurobindo Pharma Ltd, India to design and perform this bioequivalence study and to determine whether the test formulation developed by Aurobindo is bioequivalent to reference formulation. The authors have indicated that they have no other conflicts of interest regarding the content of this article.
References
- https://www.accessdata.fda.gov/drugsatfda_docs/label/2008/008708s025lbl.pdf.
- https://pubchem.ncbi.nlm.nih.gov/compound/phenoxybenzamine#section=Top.
- Zwi T. Homonnai., et al. Science Direct Elsevier. Contraception 29 (1984): 479-491.
- In Pocket Companion to Brenner and Rector's the Kidney (Eighth Edition), Science Direct Elsevier. Chapter 25 – Antihypertensive drugs (2011): 511-545.
- William F. Young, in Williams Textbook of Endocrinology (Thirteenth Edition), Science Direct Elsevier Chapter 16 – Endocrine Hypertension (2016): 556-588.
- Chow SC aand Liu JP. Design and Analysis of Bioavailability and Bioequivalence Studies. 3rd ed. Boca Raton, Fl: Chapman & Hall/CRC; (2008).
- Shargel L, Yu ABC. Applied Biopharmaceutics and Pharmacokinetics. Stamford, Conn: Appleton & Lange Norwalk; (1999).
- Balthasar JP. “Bioequivalence and bioequivalency testing”. American Journal of Pharmaceutical Education63.21999: 194-198.
- Food and Drug Administration (FDA). Guidance for industry: bioavailability and bioequivalence studies for orally administered drug products — general considerations. Rockville, Md: United States Department of Health and Human Services, FDA, Center for Drug Evaluation and Research (CDER), Revision 1; (2003).
- European Medicines Agency (EMEA). Guideline on the investigation of bioequivalence [CPMP/EWP/QWP/1401/98], Rev.1/Corr**. London, UK;20January (2010).
Citation:
Akula Thukaram Bapuji., et al. “Bioequivalence Study of Phenoxybenzamine Capsules 10 mg in Healthy Volunteers under
Fasting Conditions”. Chronicles of Pharmaceutical Science 2.2 (2018): 523-533.
Copyright: © 2018 Akula Thukaram Bapuji., et al. This is an open-access article distributed under the terms of the Creative Commons Attribution License, which permits unrestricted use, distribution, and reproduction in any medium, provided the original author and source are credited.
 Scientia Ricerca is licensed and content of this site is available under a Creative Commons Attribution 4.0 International License.