Research Article
Volume 2 Issue 5 - 2018
The Use of Tensiometers as a Decision Support Tool in Irrigation Scheduling for Strawberry Production in the Pajaro Valley, California
1Resource Conservation District of Santa Cruz County, 820 Bay Ave, Capitola, CA 95010
2Ramos Farms, PO Box 1675, Freedom, CA 95019
2Ramos Farms, PO Box 1675, Freedom, CA 95019
*Corresponding Author: Gerardo Spinelli, Resource Conservation District of Santa Cruz County, 820 Bay Ave, Capitola, CA 95010.
Received: April 07, 2018; Published: May 16, 2018
Abstract
Strawberries are one of the most important crops in Santa Cruz and Monterey Counties and are very sensitive to water stress. As part of a water conservation effort, better irrigation management tools are needed to save water while maintaining high yields. Soil moisture monitoring can aid growers in irrigation scheduling, however more robust recommendations need to be developed. Soil tension was measured with tensiometers at depths of 6 and 12 inches at three ranches to explore the effects of soil tension on crop yields, determine an adequate soil tension threshold to trigger irrigation and to determine the required number of tensiometers per ranch. Transient conditions of soil tension, well above the management threshold, were observed in the study with daily increases in soil tension of about 1 kPa per day in spring and of about 3 kPa per day in summer. Daily mean and daily maximum tension were significantly affected by the evaporative demand of the atmosphere, thus it appears that irrigation intervals of 2 to 3 days are adequate in summertime and during high ETo periods to avoid soil tensions above 20 kPa. There is evidence that at least two stations of tensiometers per field and at least two instruments per depth per station are needed to obtain a representative sample of soil tension in the field. Finally, a decrease in marketable yields associated with mean seasonal soil tension measured at 6” depth was observed, but not show a statistically significant relationship. This analysis was based on a small dataset and was affected by other factors such as soil type and plant disease. More research is needed to explore the relationship between strawberry yields and soil tension management.
Introduction
Strawberries are one of the most important crops in Santa Cruz and Monterey Counties, accounting for $229,107,000 and $706,875,000 of total agricultural value in 2016, respectively (Santa Cruz and Monterey County Crop Reports 2016). Because strawberries are sensitive to water stress, they require high soil moisture. Small depletions in soil moisture can reduce commercial yield and product quality substantially. The major agricultural areas of the counties, the Pajaro and the Salinas Valleys, are suffering from groundwater overdraft and seawater intrusion. Water conservation and efficient irrigation water management are paramount to bringing the aquifers into balance. As part of this effort, the Resource Conservation District of Santa Cruz County started a loaner program to encourage the adoption of tensiometers as a management tool to schedule irrigations. The advantage of using tensiometers for irrigation management is that the instrument output is independent of soil type and it provides a measure of the physiological stress to which plants are exposed. However, contrasting results have been reported about the thresholds of soil tension recommended to achieve maximum production and quality in strawberry production in the area. Growers in the area use various thresholds of maximum tension in the soil to trigger the decision to irrigate, ranging from 10 to 20 kPa. Additionally, it is not clear what is the best number of sensors that should be deployed in each field and at what depths in order to achieve a representative measurement of soil tension in the field. In this study, we report the results of two years of soil tension monitoring on three different ranches with different soil types. The average soil tension and commercial yield data are reported for each ranch. Additionally, statistical analyses were performed to investigate whether more than one station of instruments per field and more than one instrument per depth are needed to inform irrigation schedules.
Materials and Methods
Experimental Ranches
Sensors were deployed on three commercial strawberry production ranches in the Pajaro Valley. Codes were assigned to each ranch for anonymity. The codes include RR, DB, and MS. Within each ranch, one, two or three stations of tensiometers were deployed.
Sensors were deployed on three commercial strawberry production ranches in the Pajaro Valley. Codes were assigned to each ranch for anonymity. The codes include RR, DB, and MS. Within each ranch, one, two or three stations of tensiometers were deployed.
Tensiometers
Two models of tensiometers were used in this study. The first instruments were tensiometers from Irrometer Company (Riverside, CA), model ‐LT, 6 and 12 inches in length. The data were collected using pressure transducers (model RSU‐V) and magnetic automatic gauges (model “A”). The other tensiometers were from Hortau (San Luis Obispo, CA) and were deployed by the company. The data were downloaded from the company’s web app (irrolis.hortau.net). The instruments were installed on the plant line, between two plants, at 6 or 12 inches of depth. Different numbers of sensors were installed in each ranch in 2016 and 2017. Sensors within one station were placed about 3 feet from each other. Four instruments per station (two at 6” and two at 12”) were installed at three stations on the ranch RR in 2016, totaling 12 instruments. In 2017 at RR, five instruments per station (three at “6 and two at 12”) were installed in three stations, totaling 15 instruments. Four instruments (two at 6” and two at 12”) were installed at MS in 2016, and two (one at 6” and one at 12”) in 2017. Four instruments (two at 6” and two at 12”) were installed at DB in 2016, and two (one at 6” and one at 12”) in 2017.
Two models of tensiometers were used in this study. The first instruments were tensiometers from Irrometer Company (Riverside, CA), model ‐LT, 6 and 12 inches in length. The data were collected using pressure transducers (model RSU‐V) and magnetic automatic gauges (model “A”). The other tensiometers were from Hortau (San Luis Obispo, CA) and were deployed by the company. The data were downloaded from the company’s web app (irrolis.hortau.net). The instruments were installed on the plant line, between two plants, at 6 or 12 inches of depth. Different numbers of sensors were installed in each ranch in 2016 and 2017. Sensors within one station were placed about 3 feet from each other. Four instruments per station (two at 6” and two at 12”) were installed at three stations on the ranch RR in 2016, totaling 12 instruments. In 2017 at RR, five instruments per station (three at “6 and two at 12”) were installed in three stations, totaling 15 instruments. Four instruments (two at 6” and two at 12”) were installed at MS in 2016, and two (one at 6” and one at 12”) in 2017. Four instruments (two at 6” and two at 12”) were installed at DB in 2016, and two (one at 6” and one at 12”) in 2017.
Flowmeters and Dataloggers
The flowmeters used to monitor irrigations were Netafim WMR and WST series, 3” and 4” models. The flowmeters were connected to dataloggers through a reed switch output. The dataloggers used in this study were Campbell Scientific CR1000 and CR200 series.
The flowmeters used to monitor irrigations were Netafim WMR and WST series, 3” and 4” models. The flowmeters were connected to dataloggers through a reed switch output. The dataloggers used in this study were Campbell Scientific CR1000 and CR200 series.
Reference Evapotranspiration and precipitation
For the statistical analysis preformed with the data collected at the RR ranch in 2017, daily reference evapotranspiration (ETo) and precipitation data were obtained from CIMIS station # 209 located in Watsonville West, CA (http://cimis.water.ca.gov) for the period between January 1st 2017 and December 31st 2017.
For the statistical analysis preformed with the data collected at the RR ranch in 2017, daily reference evapotranspiration (ETo) and precipitation data were obtained from CIMIS station # 209 located in Watsonville West, CA (http://cimis.water.ca.gov) for the period between January 1st 2017 and December 31st 2017.
Data processing and statistical analysis
The data obtained at RR in 2017 were aggregated by day, to calculate daily mean and maximum for each day. Additionally, the daily mean tension was compared for instruments installed at 6 and 12 inches for the whole dataset using ANOVA analysis using the R statistical computing environment (aov function) to analyze differences in sensor depth. Data obtained from sensors installed at 6 inches were compared across three stations to investigate differences between stations. Data from sensors installed at 6 inches, in station 1 were compared to investigate differences between sensors within the same station. Tension data from all three ranches were averaged for each planting season and for each soil depth, to obtain a seasonal mean tension for each sensor depth. Yield data were analyzed statistically with linear regression and ANOVA analyses (lm and aov function) using the R statistical software).
The data obtained at RR in 2017 were aggregated by day, to calculate daily mean and maximum for each day. Additionally, the daily mean tension was compared for instruments installed at 6 and 12 inches for the whole dataset using ANOVA analysis using the R statistical computing environment (aov function) to analyze differences in sensor depth. Data obtained from sensors installed at 6 inches were compared across three stations to investigate differences between stations. Data from sensors installed at 6 inches, in station 1 were compared to investigate differences between sensors within the same station. Tension data from all three ranches were averaged for each planting season and for each soil depth, to obtain a seasonal mean tension for each sensor depth. Yield data were analyzed statistically with linear regression and ANOVA analyses (lm and aov function) using the R statistical software).
Results
The data obtained from the RR ranch in 2016 and 2017 show that the grower employed an irrigation schedule that maintained the tension in the soil below 10 kPa (Figure 1 and Figure 2). However, occasionally the shallower instruments recorded transient conditions where tension exceeded 20 kPa. The data show a clear daily increase in soil tension and a drop when irrigation water was applied. During high ETo months, the average daily increase in soil tension was about 3 kPa and tensions approaching 10 kPa were observed on the third day after one irrigation event (Figure 1). During low ETo months, soil tension increased by about 1 kPa per day, and it generally took 6 days after one irrigation event before soil tensions reached 10 kPa (Figure 2).
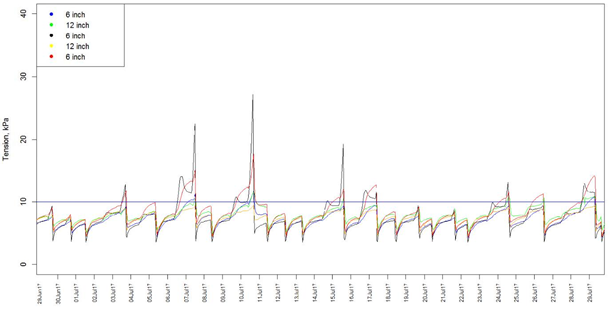
Figure 1: Example of hourly data obtained from a grower that targeted 10 kPa as the maximum soil tension in a month of high ETo.
Each line represents the hourly output of a tensiometer located at the same station, within 10 feet from the other instruments. The horizontal blue line represents the threshold of 10 kPa used by the grower as a trigger for irrigations.
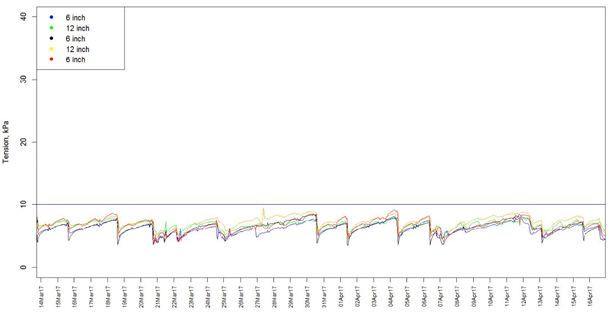
Figure 2: Example of hourly data obtained from a grower that targeted 10 kPa as maximum soil tension in a month of low ETo.
Each line represents the hourly output of a tensiometer located within the same station. The horizontal blue line represents the threshold of 10 kPa used by the grower as a trigger for irrigations.
At the DB ranch, where the grower uses 20 kPa as a trigger for irrigations, the instruments recorded mean daily tensions generally below 20 kPa. However, tensions above 30 kPa were occasionally observed, and in some cases they reached 50 kPa (Figure 3).
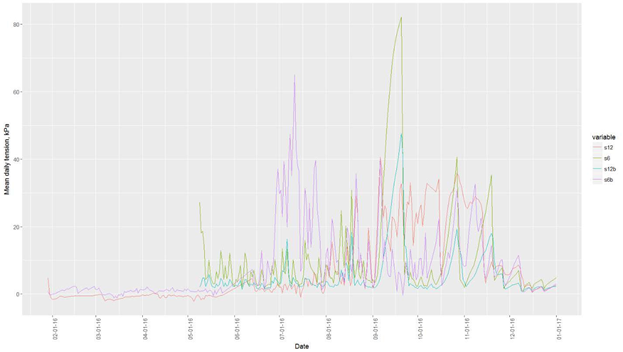
Figure 3: Example of daily mean soil tension obtained from a grower that targeted 20 kPa as maximum soil tension. Each line represents the mean daily average of a tensiometer. Two stations were installed on the ranch, with two instruments installed at depths of 6 and 12 inches.
At the RR ranch the daily mean data in 2017 was generally below 10 kPa, but occasionally it reached 20 kPa (Figure 4). The daily maximum data from the same ranch shows data above 30 kPa (Figure 5).
Statistical analyses performed on the data collected on the RR ranch in 2017 yielded statistically significant relationships between daily mean tension and days from last irrigation, between daily maximum tension and days from last irrigation, between daily mean tension and daily ETo and between daily maximum tension and daily ETo. However, the first two relationships yielded negative slopes. The relationship between maximum daily tension and reference ET was also significant and yielded a positive slope (Figure 6). The relationship between daily mean tension and sensor depth and between daily maximum tension and sensor depth were analyzed with analysis of variance. The first relationship was non‐significant, while the second was statistically significant (Table 1). In general, 6 inch deep sensors were observed to have a larger range of soil tension values, since they are in the zone where most roots and water occur.
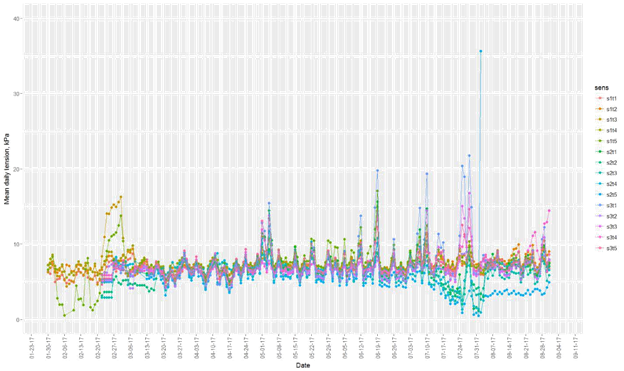
Figure 4: Mean daily tension for the year 2017 obtained from the RR ranch from 15 tensiometers divided between three stations.
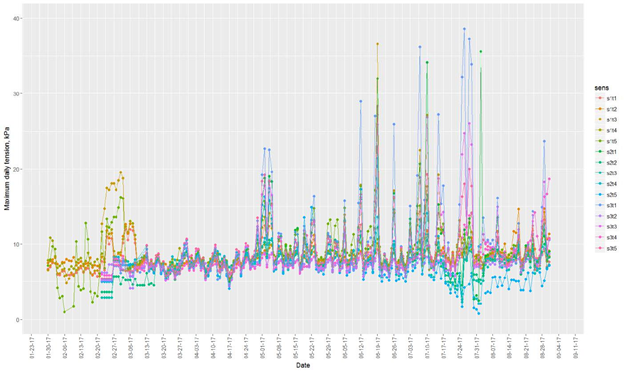
Figure 5: Maximum daily tension for the year 2017 obtained from the ranch RR ranch from 15 tensiometers divided between three stations.
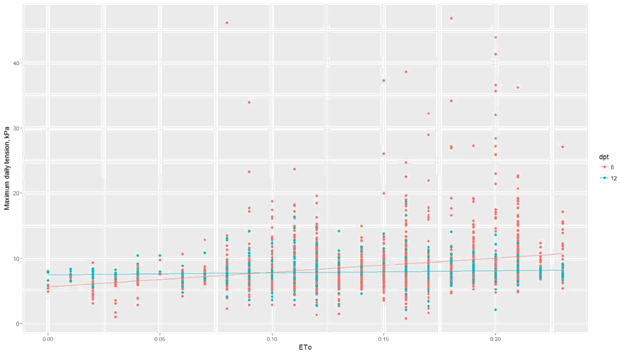
Figure 6: Relationship between maximum daily tension and reference ET for tensiometers installed at 6 and at 12 inches on the RR ranch in 2017.
| Relationship | Observations | Regression | p‐value | Analysis |
| (n) | slope | |||
| Daily mean tension vs. Days from last irrigation | 2935 | ‐0.05 | 0.0002*** | Linear regression |
| Daily maximum tension vs. Days from last irrigation | 2935 | ‐0.16 | 8.9e‐12*** | Linear regression |
| Daily mean tension vs. Daily ETo | 2935 | 6.41 | <2e‐16*** | Linear regression |
| Daily maximum tension vs. Daily ETo | 2935 | 14.37 | <2e‐16*** | Linear regression |
| Daily mean tension vs. Sensor depth | 2935 | ‐ | 0.08 NS | Anova |
| Daily maximum tension vs. Sensor depth | 2935 | ‐ | 1.2e‐12*** | Anova |
* = significant at the 0.05 level, ** = significant at the 0.01 level, *** = significant at the 0.001 level
Table 1: Statistical analyses of the daily mean and daily maximum tension relationships with days from last irrigation, reference ET (ETo) and sensor depth from the dataset collected at the ranch RR in 2017.
Table 1: Statistical analyses of the daily mean and daily maximum tension relationships with days from last irrigation, reference ET (ETo) and sensor depth from the dataset collected at the ranch RR in 2017.
The data collected at RR in 2017 were also analyzed in order to answer the following questions: “Are the data collected at different depths significantly different?”, “Are the data collected at the same depth in different stations significantly different?” and “Are the data collected within the same station at the same depth significantly different?”. All statistical analyses yielded significant relationships (Table 2).
| Question | Observations (n) |
Mean | Tension | kPa | p‐value |
| Are the depths significantly different? | 84609 | 6 inch | 12 inch | <2e‐16*** | |
| 7.11b | 7.45a | ||||
| Are the stations significantly different (6 inch only)? | 50534 | Stat 1 | Stat 2 | Stat 3 | <2e‐16*** |
| 7.6a | 6.2b | 7.4c | |||
| Are the instruments within station 1 different (6 inch only)? | 18593 | Instr 1 | Instr 3 | Instr 5 | <2e‐16*** |
| 7.2a | 7.5b | 8.2c |
* = significant at the 0.05 level, ** = significant at the 0.01 level, *** = significant at the 0.001 level
Table 2: Results of the statistical analyses performed on the hourly tensiometer data collected at RR in 2017.
Table 2: Results of the statistical analyses performed on the hourly tensiometer data collected at RR in 2017.
The average seasonal tension measured at 6 and 12 inches in years 2016 and 2017 on the three ranches included in the study are reported in Table 3. The number of sensors installed per ranch, the threshold of soil tension used to trigger irrigation events, the strawberry variety grown and the seasonal marketable yield of each ranch are also included.
| Ranch | Year | Seasonal mean tension at 6 inch, kPa |
Seasonal mean tension at 12 inch, kPa | # of sensors installed | Threshold tension at 6”, kPa |
Variety | Soil Type | Yield, lb/ac |
| RR | 2016 | 8.8 | 4.4 | 12 | 10 | San Andreas | Sandy Loam | 76,800 |
| RR | 2017 | 7.3 | 8 | 15 | 10 | San Andreas | Sandy Loam | 92,475 |
| DB | 2016 | 9.6 | 6.3 | 4 | 20 | Proprietary 1 | Heavy Clay | 67,800 |
| DB | 2017 | 15 | 3.8 | 4 | 20 | Proprietary 2 | Heavy Clay | 82,400 |
| MS | 2016 | 5.4 | 5.1 | 4 | 6 | Monterey | Sandy Loam | 86,400 |
| MS | 2017 | 5.4 | 9 | 2 | 6 | Monterey | Sandy Loam | 99,000 |
Table 3: Seasonal mean tension, number of sensors installed, irrigation management tension threshold, strawberry variety and yields.
Table 4 and Figure 7 report the results of statistical analyses performed on the relationships between marketable yield and seasonal mean tension measured at a depth of 6 inches, at a depth of 12 inches and between yield and the soil tension threshold used as a management tool to trigger irrigation events. The relationships shown are not statistically significant, however the linear regression between yield and seasonal mean tension at 6 inches produced a negative slope, indicating a reduction in yield of 1,474 lb per additional kPa of seasonal mean soil tension.
| Relationship | Observations (n) | Regression slope | p‐value | Analysis |
| Yield vs. Seasonal mean tension at 6 inch | 6 | ‐1474 | 0.34 NS | Linear regression |
| Yield vs. Seasonal mean tension at 12 inch | 6 | 3290 | 0.20 NS | Linear regression |
| Yield vs. Irrigation management threshold | 6 | ‐ | 0.35 NS | ANOVA |
Table 4: Statistical analyses of the relationships between marketable yields and seasonal mean tension measured at 6 inches, seasonal mean tension measured at 12 inches and irrigation management tension threshold.
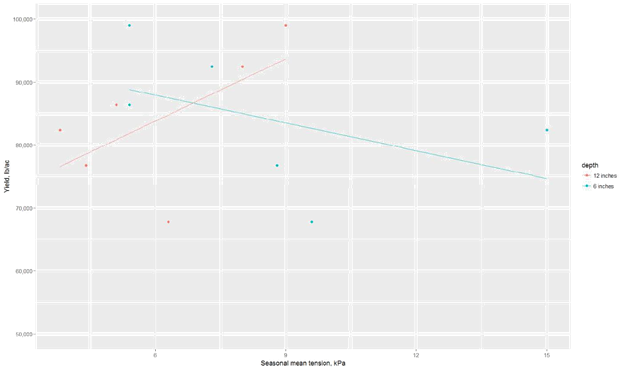
Figure 7: Linear regressions of the relationship between marketable yield and seasonal mean tension measured at two depths.
Discussion
The soil tension data collected in this study show evidence that in summer, in the climatic conditions of the area, a general guideline to schedule irrigation events is to keep the interval between irrigations below three days in order to maintain low soil tension. On the third day from the last irrigation event, soil tension at 6 inches of depth can increase rapidly and temporary tensions above 20 kPa can be observed, particularly in sandy soils even when thresholds of 10 kPa are used as a trigger for irrigation. This concept is well illustrated by the comparison of mean daily tension and maximum daily tension. The effects of the occurrence of these short periods of water stress on yields is unknown, but there is anecdotal knowledge among growers that these conditions may have a negative impact on yield. In springtime, the observed daily increase in soil tension was about 1 kPa per day, so in this season, choosing a threshold of 6 or 10 kPa makes a substantial difference in terms of what day an irrigation event is triggered; on the other hand, in summer, the observed daily increase in soil tension was about 3 kPa so using a 6 or 10 kPa threshold appears to make little or no difference in summer irrigation management.
Both daily mean tension and daily maximum tension showed a statistically significant relationship with ETo suggesting that careful irrigation management is needed during summertime particularly during periods of high evaporative demand. It appears that short irrigation intervals (2 or 3 days) should be employed in order to maintain low soil tension, particularly in summer; on the other hand, it does not seem necessary to irrigate daily, even during periods of high evaporative demand.
While growers and service providers agree on the necessity of installing instruments at different depths, there seems to be disagreement among operators with regard to the need for installing multiple stations of sensors in the same field and/or multiple sensors per stations. The statistical analyses performed in this study indicated that there was significant difference in the soil tension measured at two different depths, between the sensors at the same depth in different stations and at the same depth within the same station. In the experiment, three stations were installed in the same irrigation block, so the irrigation was managed in the same manner for all stations. Additionally, the cost associated with installing one more sensor is minimal compared with the electronics (dataloggers, modems) needed to collect and transmit the data, so it seems wise to install at least two sensors per depth at each station.
The relationships between marketable yields at the ranches and seasonal mean soil tension or soil tension management threshold were non‐significant and the sample size was relatively small. The relatively high yields observed at the DB ranch compared to the seasonal mean tension recorded, may have been associated with the heavy clay soil type observed at the ranch, while at the other ranches soils were loams or sandy loams. Additionally, in 2016 at the RR ranch, the yields were severely limited by the presence of soil borne diseases.
Hoppula and Salo (2007) did not observe significant differences in marketable yield in strawberry grown in soil with tension treatments of 15, 30 and 60 kPa. However, the study was carried in low‐yielding conditions and in perennial strawberry productions, with average yields of 4,370 Kg/ha or 3,898 lb/ac. Clark., et al. (1996), grew strawberry in Florida in sandy soils applying three soil tension treatments, 5, 10 and 15 kPa, in a system more similar to the California Central Coast conditions, where the average yield across treatments was 21900 Kg/ha (19600 lb/ac). Although no statistically significant difference was observed between the treatments, the authors suggest that 10 kPa may be an appropriate target for soil tension management in sandy soils. The decrease in marketable yield associated with an increase in soil tension at a depth of 6 inches observed in this study, although not statistically significant, supports Clark’s conclusion. More research, with a larger sample size, is needed to explore the relationship of crop yield and soil tension in strawberry production while accounting for additional complicating factors such as plant diseases and soil type.
In conclusion, our study shows evidence that 1) transient conditions of soil tension well above the management threshold are commonly observed in the field; 2) daily increases of about 1 kPa per day in spring and of about 3 kPa per day in summer seem common in the area; 3) irrigation intervals of 2 to 3 days appear to be the best irrigation strategy for summertime; 4) daily mean and daily maximum tension are significantly affected by the evaporative demand of the atmosphere and careful management is needed during high ETo periods; 5) at least two stations of tensiometers per field and at least two instruments per depth per station seem to be needed; 6) the marketable yields observed did not show a significant relationship with seasonal mean soil tension or soil tension threshold.
References
- Cahn M and Farrara B. “Using tensiometers for scheduling irrigations of coastal vegetables”. UC Cooperative Extension of Monterey County
- Clark Gary., et al.“Water Requirements and Crop Coefficients of Drip‐irrigated Strawberry Plants”. Transactions of the American Society of Agricultural Engineers 39 (1996): 905‐913.
- Hoppula KI and Salo TJ. “Irrigation Science”. 25 (2007): 401.
- R Core Team. “R: A language and environment for statistical computing”. R Foundation for Statistical Computing (2015):
Citation:
Gerardo Spinelli., et al. “The Use of Tensiometers as a Decision Support Tool in Irrigation Scheduling for Strawberry Production
in the Pajaro Valley, California”. Innovative Techniques in Agriculture 2.5 (2018): 478-486.
Copyright: © 2018 Gerardo Spinelli., et al. This is an open-access article distributed under the terms of the Creative Commons Attribution License, which permits unrestricted use, distribution, and reproduction in any medium, provided the original author and source are credited.


 Scientia Ricerca is licensed and content of this site is available under a Creative Commons Attribution 4.0 International License.