
Member In


Recent Edition

Ophthalmology and Vision Science

Oral Health and Dentistry

Orthopaedic Surgery and Traumatology

Nutrition and Food Toxicology

Gynaecology and Perinatology

Anaesthesia, Critical Care and Pain Management

Holistic Approaches in Oncotherapy

Current Opinions in Neurological Science

Therapeutic Advances in Cardiology

Multidisciplinary Advances inVeterinary Science

Chronicles of Pharmaceutical Science

Innovative Techniques in Agriculture

Clinical Biotechnology and Microbiology

Pulmonology Research and Respiratory Care

Chronicle of Medicine and Surgery

Archives of Endocrinology and Diabetes Care

Bulletin of Clinical Immunology

Medical Research and Clinical Case Reports
Research Article
Volume 3 Issue 4 - 2019
Increasing Maize Yield through Crop Intensification in the Central Rift Valley of Ethiopia
1Hawassa University, Faculty of Biosystems and Water Resources Engineering, P.O.Box.05, Hawassa, Ethiopia
2Wageningen University, Soil Physics and Land Management Group, Droevendaalsesteeg 4, 6708 PB Wageningen, Netherlands
2Wageningen University, Soil Physics and Land Management Group, Droevendaalsesteeg 4, 6708 PB Wageningen, Netherlands
*Corresponding Author: Alemayehu Muluneh, Hawassa University, Faculty of Biosystems and Water Resources Engineering, P.O.Box.05, Hawassa, Ethiopia.
Received: October 24, 2018; Published: July 29, 2019
Summary
Maize yield in the Central Rift Valley of Ethiopia (CRV) suffers from dry spells at sensitive growth stages. We tested the hypothesis that crop intensification through supplemental irrigation (SI) from Rain Water Harvesting (RWH) systems and a higher plant density of a hybrid variety under increased fertilization might bridge dry spells, reduce risk of crop failure and increase yield. First, we estimated the availability of sufficient runoff in dry years for water harvesting. The long term dry spell analysis was carried out using long term (1970-2009) daily rainfall data. During 2012 (dry) and 2013 (wet) on-farm field research was conducted with 10 combinations of supplemental irrigation and plant density. The simplest was rainfed farming with 30,000 plants ha-1. The most advanced was no water stress and 75,000 plants ha-1. We compared our on-farm yield with that of neighbouring farmers. The 42 years (1970-2011) daily rainfall analysis proves the occurrence of long dry spells (>10 days) during the Belg season. The result showed that despite significant maize yield difference between rainfed and SI, it is not worth the effort to use SI during non-critical drought years since it is not financially feasible. There was a significant yield increase as we increased plant density from 30,000 plants ha-1 to 75,000 plants ha-1. The 2012 & 2013 average grain yield difference between farmers practice and on-farm research was 81%. This yield difference is attributed to the difference in fertilizer use.
Keywords: Dry spell; Maize; Plant density; Supplemental irrigation; Water harvesting
Introduction
The food security of smallholder farmers in sub-Saharan Africa is largely constrained by water availability. However, in many sub-Saharan African countries there is sufficient average rainfall over the crop season to obtain good yields, but yields are greatly reduced by periods of > 10 consecutive dry days at critical growth stages of the crop. Water stress at flowering stage of maize, for example, reduces yields by 60%, even if water is adequate throughout the crop season (Seckler & Amarasinghe, 2000). Therefore, the key challenge is to reduce water shortage-related risks posed by high rainfall variability rather than coping with an absolute lack of water.
A related problem is that, due to the potential risk of crop failure from periodic water scarcity, small-holder farmers are not willing to invest in fertilizer and other inputs. This can be attributed to farmers’ aversion to risk. Thus, less risk of crop failure due to crop water deficits may improve farmers’ willingness and ability to further invest in fertilizers and other management strategies (Barron, 2004).
The Central Rift Valley of Ethiopia (CRV) is one of the most drought prone areas in Ethiopia. Halaba Special Woreda, where this study was conducted, is one of the areas most affected by recurrent drought and crop failure. Hence it is known as a drought-prone and food insecure woreda. Even in a year where rainfall is favourable, the yield is not as large as it should be, because farmers in this Woreda are constrained from using fertilizer by risk of crop failure due to high chances of dry spells occurring in the growing season and the high level of fertilizer prices. Rain Water Harvesting (RWH), defined as any practice that collects runoff for productive purposes is one of the tools for small-holder farmers used to ensure crop water supply through supplemental irrigation (Fox & Rockström, 2003). RWH can increase opportunities for crop intensification and investments in smallholder farming.
In Ethiopia Rain Water Harvesting Technologies (RWHT) are introduced and encouraged on a large scale for field crop production since early 2000s (Wakeyo & Gardebroek, 2013). However, it is mostly limited to vegetable production at home backyards. In Halaba, surface and ground water resources are limited so that RWH in the form of individual farm ponds are used as a means of coping strategy for the water scarcity. The water of these ponds is mainly used for small-scale vegetable cropping, livestock and household. Ponds are the dominant RWHT used in Ethiopia.
In Halaba, maize is the staple crop grown on more than 50% of the cultivable land, while all other crops grown in the area such as tef, wheat, pepper, haricot bean, sorghum and millet account for the remaining 50% of the area. Long cycle maize (145 days) is grown with planting in the Belg season (March-May) and harvest in the Kiremt (June-September) season. Dry spells during the Belg create serious moisture stress at critical stages of crop growth causing widespread damage to the maize in Halaba in particular. Climate projections in the CRV also showed that the effect of climate change will become more serious during the Belg season (Muluneh et al., 2015).
In Ethiopia, due to its high yield potential and wide adaptation, maize is one of the national commodity crops to satisfy the food self-sufficiency program of the country. It is common believe that supplemental irrigation from RWH for staple crops is not realistic. For example in semi-arid Kenya it was observed that crops with high water demand such as maize, even with rainwater harvesting, can wilt when the distribution of rainfall within the season is erratic (Recha et al., 2014). However, we hypothesize that intensification of maize cropping may bridge dry spells, reduce risk of crop failure and increase yield that can ultimately solve food insecure situations as in Halaba area. Under such a situation supplemental irrigation is a viable activity. The higher the degree of crop intensification would lead to the higher water productivity, i.e. the number of kg biomass that is produced per m3 of water (Sime and Aune, 2015). Therefore, we include supplemental irrigation, optimum fertilization and plant density in our crop intensification.
Plant density is one of the most important cultural practices that influences maize grain yield (Sangoi, 2000). At low densities, many modern maize hybrids do not tiller effectively and quite often produce only one ear per plant (Sangoi, 2000). The introduction of hybrids with higher plant densities due to narrower spacing of rows can use available light more efficiently and also shade the surface soil more completely during the early part of the season while the soil is still moist. Therefore, less water will be lost from the soil surface by soil evaporation. On the other hand, maize grain yield declines when plant density is increased beyond the optimum plant density primarily because of decline in the harvest index and increased stem lodging (Tollenaar et al., 1997). This is due to intense interplant competition for incident light, soil nutrients and soil water. Thus, there is an optimum population density that maximizes the utilization of available resources. Traditionally, farmers in the CRV use 30,000-40,000 plants ha-1 for maize. However, for most hybrid maize varieties released in Ethiopia, plant density has not been determined under different environmental conditions.
In this study we investigate whether maize intensification using supplemental irrigation, optimum plant density under increased fertilizer use in terraced farms is a viable option in significantly improving crop yield and water productivity in CRV of Ethiopia. The specific objectives of this study are: (i) to assess occurrence of dry spells, (ii) to evaluate the potential of runoff water that could be collected in to farm ponds for maize supplemental irrigation, (iii) to identify the best combination of plant density and supplemental irrigation for optimum maize yield, and (iv) to compare yield between on-farm experiments and farmers own practices.
Materials and Methods
Site description
The field experiment site is located in the CRV of Ethiopia at Halaba Special Woreda (district) (7o17’N and 38o06’E), which is situated 315 km south of Addis Ababa and about 85 km northwest of the regional capital, Hawassa (Figure 1). The Woreda lies at an altitude between 1554 – 2149 m above sea level (m.a.s.l) but most of the woreda is found at about 1800 m.a.s.l., with the topography ranging from flat (61.3%), rolling (21.3%) and hilly (17.4%) terrain. The experimental farms are located in the rolling terrain.
The field experiment site is located in the CRV of Ethiopia at Halaba Special Woreda (district) (7o17’N and 38o06’E), which is situated 315 km south of Addis Ababa and about 85 km northwest of the regional capital, Hawassa (Figure 1). The Woreda lies at an altitude between 1554 – 2149 m above sea level (m.a.s.l) but most of the woreda is found at about 1800 m.a.s.l., with the topography ranging from flat (61.3%), rolling (21.3%) and hilly (17.4%) terrain. The experimental farms are located in the rolling terrain.
;)
Figure 1: Location of the study area where the field experiment was conducted, Halaba woreda, in Central Rift valley of Ethiopia.
The climate of the study area is dry sub-humid, with an aridity index of 0.56 computed as the ratio of mean annual precipitation to mean annual ETo. The study area is characterized by two rainy seasons: Belg and Kiremt. The small rainy season (Belg) is during March-May and the main rainy season (Kiremt) is during June-September. The annual rainfall varies between 675 to 1221 mm with a mean of 922 mm for the past 42 years (1970-2011).
According to the FAO classification system, the most dominant soil of the woreda is Vitric Andosol. As a result of a long history of agriculture and high population pressure in the area, vegetative cover is very low. Consequently, there is an erosion hazard in sloping areas. Gullies are common in many areas of the Woreda, which is aggravated by the easily detachable nature of the soil. Soil physical characteristics such as bulk density, field capacity, permanent wilting point and water content at saturation were determined in the laboratory (Table 1).
| Soil water content (vol %) | ||||
| Soil layer( m) | Sat | FC | PWP | BD (gcm-3) |
| 0.0-0.20 | 42.79(1.98) | 27.71(1.07) | 10.43(0.49) | 1.02(0.032) |
| 0.20-0.40 | 42.56(1.05) | 30.99(1.40) | 11.43(0.22) | 0.94(0.038) |
| 0.40-0.60 | 44.30(2.45) | 28.13(0.77) | 12.13(0.97) | 0.94(0.104) |
Sat, water content at saturation; FC, field capacity; PWP, permanent wilting point; BD, bulk density.
Standard error of the mean in parenthesis.
Table 1: Soil physical properties of experimental fields (n=9) at the research site, Halaba special Woreda, CRV, Ethiopia.
Standard error of the mean in parenthesis.
Table 1: Soil physical properties of experimental fields (n=9) at the research site, Halaba special Woreda, CRV, Ethiopia.
Rainfall data and dry spell analysis
For this study, available 42 year data sets of daily rainfall with good quality (less than 10% missing values) for the period 1970-2011 were obtained from the National Meteorological Agency of Ethiopia. This meteorological station (Halaba station) is located in the eastern escarpment of the CRV (the dry sub-humid eco-climatic zone) and closest to our field experimental site. Based on this long term daily rainfall data, the analysis of dry spells was carried out using the statistical package Instat+3.6 (Stern et al. 2006). A dry spell was defined previously in Africa as a continuous period of “no rainfall” (< 0.85 mm day-1) during the growing season after sowing (Rockström et al., 2003).
For this study, available 42 year data sets of daily rainfall with good quality (less than 10% missing values) for the period 1970-2011 were obtained from the National Meteorological Agency of Ethiopia. This meteorological station (Halaba station) is located in the eastern escarpment of the CRV (the dry sub-humid eco-climatic zone) and closest to our field experimental site. Based on this long term daily rainfall data, the analysis of dry spells was carried out using the statistical package Instat+3.6 (Stern et al. 2006). A dry spell was defined previously in Africa as a continuous period of “no rainfall” (< 0.85 mm day-1) during the growing season after sowing (Rockström et al., 2003).
Meteorological observations were made over the entire experimental period of 2012 and 2013 using an automatic weather station (Eijkelkamp Equipment, Model 16:99 Giesbeek, the Netherlands). The automatic weather station records full climatic data such as rainfall, temperature, wind speed, sunshine hours, relative humidity and incoming radiation which can be used for calibrating ETO.
Runoff potential
The Soil Conservation Service Curve Number (SCS-CN) method was used to estimate surface runoff of daily rainfall data at the experimental site. The SCS-CN method, developed by the USDA-Soil Conservation Service (SCS, 1972) is widely used for the estimation of direct runoff in catchments ranging in size from 0.25 ha to 1000 km2. The method uses a formula where Q =f (P, Ia), where Q is amount of surface runoff (mm); P is rainfall amount (mm) and Ia is the initial abstraction, i.e. the amount of water that infiltrates before runoff occurs (mm). Estimated Ia (0.2S) by the standard SCS-CN method underestimates observed surface runoff (Shi et al., 2009).
The Soil Conservation Service Curve Number (SCS-CN) method was used to estimate surface runoff of daily rainfall data at the experimental site. The SCS-CN method, developed by the USDA-Soil Conservation Service (SCS, 1972) is widely used for the estimation of direct runoff in catchments ranging in size from 0.25 ha to 1000 km2. The method uses a formula where Q =f (P, Ia), where Q is amount of surface runoff (mm); P is rainfall amount (mm) and Ia is the initial abstraction, i.e. the amount of water that infiltrates before runoff occurs (mm). Estimated Ia (0.2S) by the standard SCS-CN method underestimates observed surface runoff (Shi et al., 2009).
It was Hawkins et al. (2002) who first developed a new curve number (CN) with a new value of Ia=0.05S from the previous Ia=0.2S. They determined the new relationship by converting the 0.2 based CN to 0.05 CN from model fitting results using rainfall-runoff data from 3078 watersheds (Eq. 1 & 2).
S0.05 = 0.8187S0.21.15 (Eq.1)
;) (Eq.2)
(Eq.2)
Where S0.05 and S0.2 are in mm; S0.05 and CN0.05 are the storage and CN values with an initial abstraction ratio (Ia/S) of 0.05Ia/S and CN0.2 and CN0.2 are the values with a 0.2 Ia/S ratio. The CN values (CN 0.2 and CN0.05) were computed with the corresponding S values (S0.2 and S0.05) using Eq.2. The CN 0.2 and S0.2 are derived from the original SCS-CN (SCS, 1972) equation. Therefore, we used a modified expression for Ia based on earlier studies (Hawkins et al., 2002; Shi et al., 2009).
The CN of a soil is a function of hydrologic soil group, slope, land use, cover and the relative wetness of the top soil (antecedent soil water conditions). The runoff harvesting catchment in our study area is a small catchment with homogenous soil, slope and land use type. The catchment area is a cropping land with slightly sloping land surface of about 5% and moderate soil water infiltration. The catchment area that collects runoff to experimental farm ponds was estimated from field observation and empirical assessment of runoff after a rainstorm.
Outcome of the SCS model was validated by comparing estimated runoff with measured runoff for nine selected events in the 2012 cropping season. Runoff was measured in the collection tanks. The model efficiency (ME) was evaluated by Nash & Sutcliff (1970) equation (Eq.3) and the Root Mean Square Error (RMSE) (Eq.4):
;) (Eq.3)
(Eq.3)
;) (Eq.4)
(Eq.4)
Where, Qobs is the observed runoff; Qest is the estimated runoff. Values for ME can range between -∞ to 1 and ME values closer to 1 and RMSE value closer to 0 indicates better model performance.
Water yield potential of a catchment for harvesting water is estimated from surface runoff. To estimate runoff potential, it is important to consider the probability of exceedance of a certain amount of rainfall. Therefore, we used daily rainfall events of dry years to estimate the runoff potential.The 80% dependable rainfall that could likely occur in 4 out of 5 years (characterized as a dry year) was used to calculate potential rainwater harvesting from the catchment area that feeds runoff into the water harvesting ponds. Long term seasonal rainfall probability was calculated using the following equation (Eq.5):
;) (Eq.5)
(Eq.5)
Where, P-rainfall probability in % of the observation of the rank ‘m’, m-rank of observed rainfall value (highest = 1; lowest = N); N-total number of observations.
The individual rainfall events of 80% dependable rainfall years were used to calculate runoff with the validated SCS method. Furthermore, runoff was calculated for years with longest dry spells (>20 days) that can affect crop yields significantly during the first 90 days after sowing and remained within the 80% dependable rainfall.
Crop water requirement
For the design of supplemental irrigation systems, it is necessary to assess the water requirement of the crop intended to be grown. The maximum crop water requirements of maize during the maize crop growing season (March-September) were determined based on Allen et al. (1998) (Eq.6):
For the design of supplemental irrigation systems, it is necessary to assess the water requirement of the crop intended to be grown. The maximum crop water requirements of maize during the maize crop growing season (March-September) were determined based on Allen et al. (1998) (Eq.6):
ETc = Kc ETo (Eq.6)
Where ETc (mm day-1) is the maximum crop water requirement computed for optimal conditions, Kc is the crop coefficient where its values was taken from Table 17 of FAO-56 (Allen et al., 1998) at different crop growth stages and ETo (mm day-1) is the reference crop evapotranspiration.
ETo was first determined using limited climate data with the daily long term temperature (1970-2011) based on FAO Penman–Monteith method and then calibrated using two years of observed full climatic data (2012 and 2013) from an automatic weather station installed at the study area and the empirical coefficients (R2=0.88; N=188) were determined as (Eq.7).
ETO = 1.10ETO tmp-0.82 (Eq.7)
ETO = 1.10ETO tmp-0.82 (Eq.7)
Where ETo tmp is The ETo determined from only long term maximum and minimum temperature.
Field experiment
An experiment was conducted on smallholder farmers’ fields in three farms with terraces and farm ponds. The experiment was laid in Randomized Complete Block Design (RCBD) with combined treatments of supplemental irrigation (SI) and plant density. The three farms were close by each other; two of them side by side and the third about 50 meters away, which help to have more or less homogeneous slope and soil conditions.
An experiment was conducted on smallholder farmers’ fields in three farms with terraces and farm ponds. The experiment was laid in Randomized Complete Block Design (RCBD) with combined treatments of supplemental irrigation (SI) and plant density. The three farms were close by each other; two of them side by side and the third about 50 meters away, which help to have more or less homogeneous slope and soil conditions.
Experimental plots are located at terraces of about 15 m wide, constructed more than a decade ago with the objective to prevent runoff and to conserve soil and water. The terraces were gradually formed behind constructed contour soil bunds. The terraces are well maintained and stabilized by plantation of terrace edges with elephant and vetiver grasses and other vegetation types. The terraces are combined with water harvesting ponds’ where occasional runoff, instead of being considered as a problem, is being harvested and used for different purposes, water that otherwise gets lost and causes soil erosion.
The three farms were used as replicates, each farm having 10 treatmentswith a plot size of 5 m x 4m (20 m2). The combinations of plant density and supplemental irrigation treatments are shown in Table 2. The lowest irrigation treatment which is rainfed alone was combined only with the lowest plant density because having a higher planting density will not be a realistic situation.
The experiment was conducted during 2012 and 2013 growing seasons. During 2012 the sowing date was on May 2 and the harvesting on September 22 while in 2013 the sowing was on May 26 and harvesting October 17. During the experimental years (2012 and 2013), the choice of sowing dates was based on availability of sufficient water harvested in the ponds for the supplemental irrigation during the experiment. The length of growing period from sowing to harvest (the time it takes for full physiological maturity) for BH540 maize hybrid is 145 days.
| Irrigation | Density | Combination | Description |
| SI1 | D1 | SI1D1 | Rainfed and 30,000 plants ha-1 |
| SI2 | D1 | SI2D1 | 75% TAW depleted and 30,000 plants ha-1 |
| D2 | SI2D2 | 75% TAW depleted and 45,000 plants ha-1 | |
| SI3 | D1 | SI3D1 | 60% TAW depleted and 30,000 plants ha-1 |
| D2 | SI3D2 | 60% TAW depleted and 45,000 plants ha-1 | |
| D3 | SI3D3 | 60% TAW depleted and 60,000 plants ha-1 | |
| SI4 | D1 | SI4D1 | No water stress and 30,000 plants ha-1 |
| D2 | SI4D2 | No water stress and 45,000 plants ha-1 | |
| D3 | SI4D3 | No water stress and 60,000 plants ha-1 | |
| D4 | SI4D4 | No water stress and 75,000 plants ha-1 |
Table 2: Supplemental irrigation and plant density combination during the field experiment, 2012, Halaba special Woreda, CRV, Ethiopia.
Irrigation
The SI treatments were SI1, SI2, SI3 and SI4 where SI1 is only rainfed without supplemental irrigation. The total available water (TAW) in the root zone (60 cm) is about 105 mm. In SI2 we applied supplemental irrigation when the percentage of moisture depletion (SWD) of TAW reached 75%, i.e. when available water (AW) reached 26 mm. In SI3 we applied supplemental irrigation when the SWD reached 60% of TAW, i.e. when AW reached 42 mm. In treatment SI4 we kept AW as much as possible close to TAW. Since it was practically difficult to keep the moisture content all the time at field capacity, we irrigated when SWD dropped below 20%, i.e. when AW reached 84 mm.
The SI treatments were SI1, SI2, SI3 and SI4 where SI1 is only rainfed without supplemental irrigation. The total available water (TAW) in the root zone (60 cm) is about 105 mm. In SI2 we applied supplemental irrigation when the percentage of moisture depletion (SWD) of TAW reached 75%, i.e. when available water (AW) reached 26 mm. In SI3 we applied supplemental irrigation when the SWD reached 60% of TAW, i.e. when AW reached 42 mm. In treatment SI4 we kept AW as much as possible close to TAW. Since it was practically difficult to keep the moisture content all the time at field capacity, we irrigated when SWD dropped below 20%, i.e. when AW reached 84 mm.
Application of SI was done using drip irrigation, since it is a method to apply precise amounts where it is needed, while minimizing evaporation losses. A low cost drip irrigation system, with no emitters but holes in the lines at every 0.30 m that uses simple containers with cloth filters for the water was used. The potential for micro irrigation such as drip irrigation is high in Ethiopia, because it is already successful at an individual level.
For the supplemental irrigation of the three farms, the experiment used two already existed household water harvesting farm ponds located close to each other in the two farms (Figure 2). The total volume of water in the two farm ponds is about 345 m3 that collects runoff from 2.2 ha catchment area.
;)
Figure 2: Farm ponds in Halaba special woreda (Central Rift valley of Ethiopia) with sediment trap in front.
When the percentage depletion of available soil water in the root zone reaches the predefined level of depletion, the amount of water applied was calculated by the equation (Panda et al., 2004) (Eq.8):
Vd=SWD% (θFC - θPWP) * Dz * A (Eq.8)
Vd=SWD% (θFC - θPWP) * Dz * A (Eq.8)
Where Vd is the volume of supplemental irrigation (m3), Dz the rooting depth (m) and A the surface area (m2) of the irrigated plot. The rooting depth varies based on the continuous assessment of the depth of the plant root.
Cropping
A widely used maize hybrid in the CRV BH540 (Bako hybrid-540) was used for this experiment. It is highly suitable for areas with altitudes varying from 1200-1800 m.a.s.l and well suited to a climate zone with a rainfall between 979 and 1040 mm and temperature 17-23°C. According to the Ethiopian Institute of Agricultural Research (EIAR, 2004), attainable yield obtained at experimental stations for maize cultivar BH540 is 8-10 Mg ha-1.
A widely used maize hybrid in the CRV BH540 (Bako hybrid-540) was used for this experiment. It is highly suitable for areas with altitudes varying from 1200-1800 m.a.s.l and well suited to a climate zone with a rainfall between 979 and 1040 mm and temperature 17-23°C. According to the Ethiopian Institute of Agricultural Research (EIAR, 2004), attainable yield obtained at experimental stations for maize cultivar BH540 is 8-10 Mg ha-1.
The supplemental irrigation treatments were tested with a combination of four different plant densities: D1, D2, D3 and D4, where D1 is a density of 30,000 plants ha-1, D2 is 45,000 plants ha-1, D3 is 60, 000 plants ha-1 and D4 is 75,000 plants ha-1.
The distance between plant rows ranges from 1.0 m for D1 to 0.45 m for D4, while we kept the distance between plants in the rows at 0.3 m for all 4 densities to coincide with drip hole distances. The recommendation from EIAR is 0.75 m between rows and 0.30 m between plants in the row.
Fertilizer was applied at 150% of the recommended amount to keep soil fertility at non-limiting level. For the CRV, the recommended fertilizer level is 100 kg of Urea and 100 kg of DAP (Debelle et al., 2001). DAP was applied at planting whereas urea was side dressed at about 4 weeks after planting.
Routine farmers’ cultural practices were carried out by local farmers such as ploughing, weeding, application of insecticide, shilshalo, etc. Shilshalo is carried out about a month after sowing the maize which is the second ploughing of maize fields to break the superficial crust of the soil between the maize rows, which can be seen as an in-situ water harvesting technique. Stem borer infestation was controlled by application of Diazonan 60% EC insecticide.
Total above ground biomass and grain yields were determined at maturity by hand-harvesting the crop from two one square meter area in each experimental plots and farmers' own plots. The biomass and grain yields were weighed after oven drying at 70oC for 48 hrs. Samples from farmers own plots were also collected from farms located at the close proximity to our on-farm experiment plots. All agricultural practices, sowing date, the slope and soil of farmers own practice plots and on farm research plots was the same. Since farmers own planting density was found to be comparable to on farm field research plant density D1, yield comparison was made between farmers own practice maize yield with on farm plant density D1 both with only rainfed.
Soil moisture and evapotranspiration
Based on periodical soil moisture measurements, the application date and quantity of supplemental irrigation were scheduled. Soil water content profiles were measured at soil depths of 20, 40 and 60 cm once a week with a Time-Domain-Reflectometer (TDR) (Eijkelkamp Equipment, Model 14.62, Giesbeek, Netherlands). Access tubes were installed at the center of each experimental plot. Additionally, gravimetric water content was determined during the growing season. Gravimetric values were converted to volumetric values by multiplying with the bulk density and use for calibrating the TDR (R2 = 0.80, N = 26).
Soil water content (vol%)=1.4×TDR reading (vol %)+4.57 (Eq.9)
The percentage depletion of the TAW in the root zone (SWD %) was estimated by the following equation (Martin et al. 1990).
;) (Eq.10)
(Eq.10)
Where is the field capacity soil water, the is the water content at permanent wilting point and is the actual soil moisture measured. Actual crop evapotranspiration in 2012 and 2013 was estimated during the experiments with a soil water balance using Eq. (11):
ETc = P+IR+ -DP-R ± ∆θ (Eq.11)
ETc = P+IR+ -DP-R ± ∆θ (Eq.11)
Where P is precipitation (mm), IR is irrigation (mm), DP deep percolation (mm), R runoff (mm) and is the change in soil water (mm) as measured with the TDR or gravimetrically. Runoff in the plots is insignificant since the plots were very flat. From the soil moisture measurements, deep percolation below the root zone of the crop could also be considered minimal. Therefore, Eq. (11) was simplified to:
ETc = P+IR±∆θ (Eq.12)
ETc = P+IR±∆θ (Eq.12)
Water productivity
The crop water productivity (WP) of maize can be expressed in terms of total dry-matter yield, WP (dry matter, or grain yield, WP (grain), per actual evapotranspiration as given by Eq.13:
The crop water productivity (WP) of maize can be expressed in terms of total dry-matter yield, WP (dry matter, or grain yield, WP (grain), per actual evapotranspiration as given by Eq.13:
WP (dry matter) = Y (dry matter) / ETc and WP (grain) = Y (grain) / ETc (Eq. 13)
Where Y (dry matter) is the total biomass yield and Y (grain) the grain yield (in kg ha-1) and P is the total actual evapotranspiration (in m3 ha-1) during the maize growing season (from sowing to harvest).
Investment in farm ponds and irrigation
According to Hartog (2012), the initial investment cost for construction of a concrete RWH farm pond of ≈100 m3 and an irrigation drip kit for 0.5 ha, is about 31500 ETB (≈1550 USD) where the details are described in Table 3. The annual maintenance cost of the pond, which is dredging and improvement of the cemented walls including replacement of wooden roof structures once in 4-5 years is estimated at ≈260 ETB (≈13USD) (Hartog, 2012).
According to Hartog (2012), the initial investment cost for construction of a concrete RWH farm pond of ≈100 m3 and an irrigation drip kit for 0.5 ha, is about 31500 ETB (≈1550 USD) where the details are described in Table 3. The annual maintenance cost of the pond, which is dredging and improvement of the cemented walls including replacement of wooden roof structures once in 4-5 years is estimated at ≈260 ETB (≈13USD) (Hartog, 2012).
Normally, the money (31500 ETB) will be borrowed from credit association with an interest rate of 18% (Hartog, 2012). The yearly payback should be about 6000 ETB to pay all the debt in 10 years. Therefore, the annual cost of the pond will be the annual interest rate (6000 ETB) plus the annual maintenance cost (260 ETB) which is about 620 ETB. A farmer can pay 6200 ETB per year by saving money that is saved because no maize has to be bought, and money that is gained from selling surplus maize from yield increase by using SI from farm ponds (Table 3).
| Material | Quantity | Unit | Unit cost(ETB) | Total cost (ETB) | ||
| Cement | 2100 | kg | 2 | 4200 | ||
| Sand | 4 | truck | 700 | 2800 | ||
| Stone | 6 | truck | 600 | 3600 | ||
| Corrugated iron sheet | 5 | number | 100 | 500 | ||
| Labor | 420 | man-days | 14 | 5400 | ||
| Drip kit | 1 | set | 15000 | 15000 | ||
| Total | 31500 | |||||
| Revenue | ||||||
| Maize use | Extra production needed per year (kg) | Unit price (ETB) | Total price (ETB) | |||
| Household consumption | 330 | 5.9 | 1947 | |||
| Surplus for sale | 851 | 5 | 4253 | |||
| Total | 1181 | 6200 | ||||
ETB = Ethiopian currency (Birr)
Table 3: Estimated cost for a household farm pond construction and drip irrigation kit and extra production needed per year to pay off investment in RWH farm ponds and irrigation system (Adapted from Hartog 2012).
Table 3: Estimated cost for a household farm pond construction and drip irrigation kit and extra production needed per year to pay off investment in RWH farm ponds and irrigation system (Adapted from Hartog 2012).
Results
Dry spell occurrences
The probability of getting >10 consecutive dry days is more than 50% from March up to the mid of May and almost less than 10% during July and August (Figure 3). The probability of getting >15 consecutive dry days is greater than 20% during March and April. When there is sowing of maize between March and April there could be a risk of moister stress since the crop starts to experience stress when there is a dry spell longer than 10 days for the first 30 days after sowing. The probability of getting >20 consecutive dry days were less than 30% during the whole maize growing season (March-September) and non-existent during the peak rainfall months of July and August. Most of the seasonal rainfall was received during flowering and grain filling stage of maize crop, since flowering and grain filling of maize takes place mainly during July and August assuming sowing takes place in early May.
The probability of getting >10 consecutive dry days is more than 50% from March up to the mid of May and almost less than 10% during July and August (Figure 3). The probability of getting >15 consecutive dry days is greater than 20% during March and April. When there is sowing of maize between March and April there could be a risk of moister stress since the crop starts to experience stress when there is a dry spell longer than 10 days for the first 30 days after sowing. The probability of getting >20 consecutive dry days were less than 30% during the whole maize growing season (March-September) and non-existent during the peak rainfall months of July and August. Most of the seasonal rainfall was received during flowering and grain filling stage of maize crop, since flowering and grain filling of maize takes place mainly during July and August assuming sowing takes place in early May.
;)
Figure 3: Probability of dry spells exceeding 5, 10, 15 or 20 days in Halaba, CRV of Ethiopia, during 1970-2011.
The 2012 year cropping season (March-September) rainfall is 635 mm, which is less than the long term (1970-2011) mean seasonal rainfall of 786 mm. Whereas, the 2013 year is one of the wettest years with 983 mm seasonal rainfall. The 2013 seasonal rainfall (983 mm) has 9% probability of occurrence which shows one of the rare seasons to occur while the 2012 seasonal rainfall (635 mm) has 87% probability of occurrence showing that it is one of the drought years.
Water supply and irrigation
Figure 4 shows the relation between estimated and measured runoff. The ME and RMSE between predicted and observed data showed that the prediction correlated fairly well with the observed data (ME=0. 72, RMSE=0.5 and r2=0.84), (Figure 4). ME Values between 0 and 1 are generally viewed as acceptable levels of performance (Krause et al. 2005). Therefore, we can apply the SCS model in the study area to predict runoff for water harvesting runoff estimation.
Figure 4 shows the relation between estimated and measured runoff. The ME and RMSE between predicted and observed data showed that the prediction correlated fairly well with the observed data (ME=0. 72, RMSE=0.5 and r2=0.84), (Figure 4). ME Values between 0 and 1 are generally viewed as acceptable levels of performance (Krause et al. 2005). Therefore, we can apply the SCS model in the study area to predict runoff for water harvesting runoff estimation.
;)
Figure 4: Observed versus estimated runoff during 2012 rainfall season, in Halaba special Woreda, CRV, Ethiopia.
During the 2012 experiment, a few weeks after sowing and during the vegetative stage of maize (during May and June) there were two dry spell periods > 10 days where supplemental irrigation was triggered based on soil moisture measurements (Figure 5). During August there was also a short dry spell that triggered SI4 supplemental irrigation.
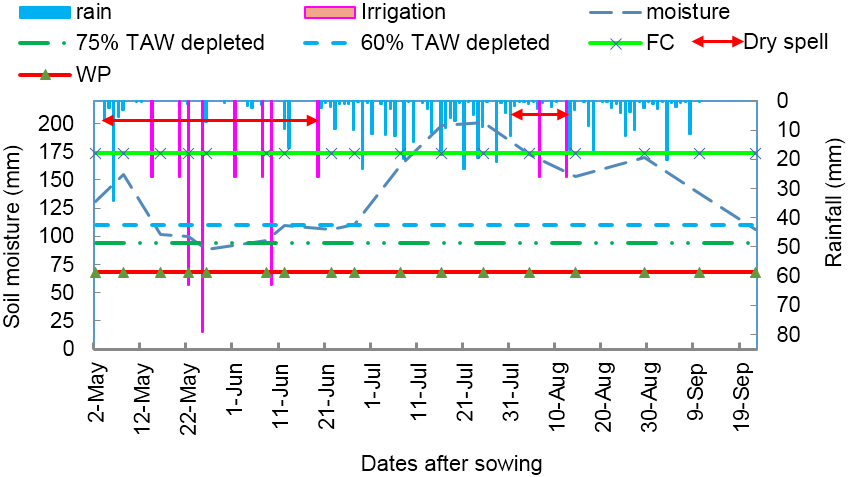
Figure 5: Rainfall and observed moisture change during 2012 experimental year with rainfed and with supplemental irrigation in Halaba, CRV, Ethiopia.
During the 2013 on-farm experiment, since the year was very wet and also the sowing of maize was late on the last week of May, there were only < 10 consecutive dry days after sowing (Figure 6). Therefore, there was no supplemental irrigation applied during the second year of our experiment (2013). The moisture content was close to the field capacity at most times of the cropping season (Figure 6).
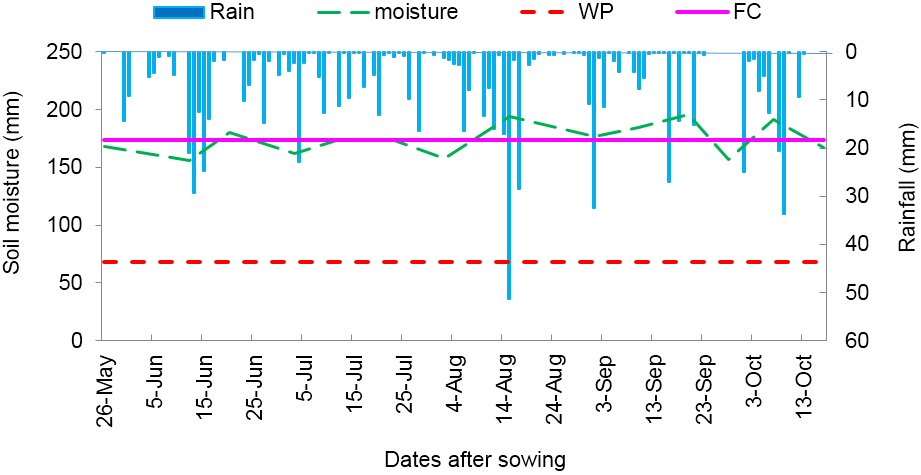
Figure 6: Rainfall and observed moisture change during 2013 experimental year using rainfed only in Halaba, CRV, Ethiopia.
Crop water requirement
Table 4 presents the crop water requirement, rainfall at 80% probability of occurrence, required supplemental irrigation and the runoff potential that can be stored in the farm ponds from the existing catchment area. Data are given per month and over the complete growing season.
Table 4 presents the crop water requirement, rainfall at 80% probability of occurrence, required supplemental irrigation and the runoff potential that can be stored in the farm ponds from the existing catchment area. Data are given per month and over the complete growing season.
Out of the 42 available years, nine years were selected with rainfall closest to the 80% dependable value. The individual rainfall events of these years were used to calculate runoff with the validated SCS method. In Table 4, the calculation of the volume of crop water requirement and runoff was based on 0.5 ha of maize farm and 2.2 ha catchment area respectively.
By comparing the 80% dependable rainfall with the crop water requirement, the months of March, May, June and July require 102, 43,123 and 88 m3 respectively. The amount of runoff volume that can be harvested from the 2.2 ha catchment area during those months will be 103,156,148,487 m3 respectively.
| Month | Crop water requirement (mm) | Rainfall at 80% chance of occurrence (mm) | Supplemental irrigation(mm) | Supplemental irrigation for 0.5 ha maize farm (m3) | Runoff (mm) | Runoff volume from 2.2 ha catchment area (m3) |
| March | 47 | 27 | 20 | 102 | 4.7 | 103 |
| April | 44 | 46 | 0 | 0 | 8.2 | 180 |
| May | 42 | 33 | 9 | 43 | 7.1 | 156 |
| June | 71 | 47 | 25 | 123 | 6.7 | 148 |
| July | 125 | 107 | 18 | 88 | 22.1 | 487 |
| August | 90 | 109 | 0 | 0 | 18.5 | 407 |
| Sept. | 51 | 59.5 | 0 | 0 | 8.55 | 188 |
| Seasonal | 469 | 428.5 | 72 | 356 | 75.91 | 1670 |
Table 4: Crop water requirement, rainfall in dry years, needed supplemental irrigation and runoff volume in maize growing months in Halaba special Woreda, CRV, Ethiopia.
Maize yield
Table 5 presents grain yield at different combinations of supplemental irrigation and plant densities for 2012 and for plant densities only for 2013 (no irrigation in 2013 because of the wet year). The highest maize yield (9.78 Mg ha-1) was obtained from the combination of SI4D4, whereas the lowest yield (7.45 Mg ha-1) was observed from the SI1D1 combination during the 2012 experimental year (Table 5). The maize yield difference obtained between SI1D1 and SI4D4 was only 31%.
Table 5 presents grain yield at different combinations of supplemental irrigation and plant densities for 2012 and for plant densities only for 2013 (no irrigation in 2013 because of the wet year). The highest maize yield (9.78 Mg ha-1) was obtained from the combination of SI4D4, whereas the lowest yield (7.45 Mg ha-1) was observed from the SI1D1 combination during the 2012 experimental year (Table 5). The maize yield difference obtained between SI1D1 and SI4D4 was only 31%.
| Experimental year 2012 | ||
| Treatments | Grain yield (Mg ha-1) | Biomass (Mg ha-1) |
| SI1D1 | 7.45 | 15.81 |
| SI2D1 | 7.79 | 16.83 |
| SI2D2 | 8.54 | 16.83 |
| SI3D1 | 8.16 | 17.63 |
| SI3D2 | 8.91 | 18.87 |
| SI3D3 | 9.04 | 19.85 |
| SI4D1 | 8.32 | 17.97 |
| SI4D2 | 9.14 | 21.35 |
| SI4D3 | 9.09 | 19.94 |
| SI4D4 | 9.78 | 21.16 |
| Experimental year 2013 | ||
| Treatments | Grain yield (Mg ha-1) | Biomass (Mg ha-1) |
| D1 | 7.81 | 15.27 |
| D2 | 8.03 | 16.73 |
| D3 | 8.81 | 19.87 |
| D4 | 9.55 | 22.5 |
Table 5: Grain yield and Total biomass of different combinations of supplemental irrigation and plant densities for 2012 and for plant densities only for 2013 (no irrigation in 2013 because of the wet year).
Maize response to supplemental irrigation
Table 6 presents grain and biomass yield for the four irrigation treatments (averaged over all combinations with different plant densities) and for the four plant density treatments (averaged over all combinations with SI). The rainfed grain yield at (SI1) showed significant difference from the grain yield at all other levels of supplemental irrigation. The grain yield at the two highest irrigation levels (SI3) and (SI4) are not significantly different. On the other hand, the total biomass showed significant difference between each of the supplemental irrigation levels (Table 6).
Table 6 presents grain and biomass yield for the four irrigation treatments (averaged over all combinations with different plant densities) and for the four plant density treatments (averaged over all combinations with SI). The rainfed grain yield at (SI1) showed significant difference from the grain yield at all other levels of supplemental irrigation. The grain yield at the two highest irrigation levels (SI3) and (SI4) are not significantly different. On the other hand, the total biomass showed significant difference between each of the supplemental irrigation levels (Table 6).
The percentage yield increase due to SI was calculated under each plant density level (Table 7). Under D1 plant density, the yield increase from SI1 to SI2 and from SI2 to SI3 are 4.6% and 4.7% respectively, showing almost the same yield increase. The increase of supplemental irrigation from SI3 to SI4 was only 2%. The increase of supplemental irrigation from rainfed (SI1) to non-stressed level (SI4) is 12%. The yield increase observed during the increase of supplemental irrigation from SI2 to SI3 and from SI3 to SI4 under D2 plant density, showed almost the same yield increase shown under D1 plant density (Table 7). But, the least yield increase (only 0.6%) observed when supplemental irrigation increased from SI3 to SI4 under D3 plant density.
| Treatments | Grain yield (Mg ha-1) | Total biomass (Mg ha-1) |
| Supplemental irrigation= 2012 experimental year | ||
| SI1 (D1) | 7.45a | 15.81a |
| SI2 (D1,D2) | 8.17b | 16.83b |
| SI3 (D1,D2,D3) | 8.70c | 18.78c |
| SI4 (D1,D2,D3,D4) | 9.08c | 20.10d |
| Density= average of 2012 &2013 experimental years | ||
| D1 | 7.87a | 16.17a |
| D2 | 8.45ab | 17.88ab |
| D3 | 8.94ab | 19.84ab |
| D4 | 9.67b | 21.83b |
Table 6: Means of grain yield and total biomass at different levels of supplementary irrigation (SI) and plant density (D).
Means sharing similar letter in respective column do not differ significantly at 5% level of probability (Bonferroni test, P<0.05)
Maize response to plant density
In 2012 experimental year, the increase in plant density from 30,000 plants ha-1 to 75,000 plants ha-1 under the same irrigation level (SI4) increased maize grain yield from 8.32 Mg ha-1 to 9.78 Mg ha-1 (18%), which could be attributed to only plant density increase (Table 7). Similarly, during the year 2013, the increase in plant density from 30,000 plants ha-1 to 75,000 plants ha-1 increased maize grain yield from 7.81 Mg ha-1 to 9.55 Mg ha-1 (22%) (Table 5).
In 2012 experimental year, the increase in plant density from 30,000 plants ha-1 to 75,000 plants ha-1 under the same irrigation level (SI4) increased maize grain yield from 8.32 Mg ha-1 to 9.78 Mg ha-1 (18%), which could be attributed to only plant density increase (Table 7). Similarly, during the year 2013, the increase in plant density from 30,000 plants ha-1 to 75,000 plants ha-1 increased maize grain yield from 7.81 Mg ha-1 to 9.55 Mg ha-1 (22%) (Table 5).
The two experimental year average grain and total biomass yield (2012 and 2013) increased as the plant density increased from D1 to the next higher plant densities (D2, D3 and D4), but statistically significant yield difference was observed only between D1 and D4 plant density (Table 6).
The percentage yield increase due to plant density was calculated under each of the supplemental irrigation levels (Table 7). The maize yield increase when the plant density increases from D1 to D2 is almost the same under SI2 and SI3 irrigation levels which is 9.63% and 9.19% respectively. Almost no maize yield increase when the plant density increases from D2 to D3 under both SI3 and SI4 irrigation levels. The maximum yield increase (≈ 18%) was obtained when the plant density increase from D1 to D4 under SI4 supplemental irrigation level.
| Irrigation | % increase | |
| D1 | SI1 to SI2 | 4.6 |
| SI2 to SI3 | 4.7 | |
| SI3 to SI4 | 2.0 | |
| SI1 to SI4 | 12.0 | |
| D2 | SI2 to SI3 | 4.3 |
| SI3 to SI4 | 2.6 | |
| SI2 to SI4 | 7.0 | |
| D3 | SI3 to SI4 | 0.6 |
| Density | ||
| SI2 | D1 to D2 | 9.6 |
| SI3 | D1 to D2 | 9.2 |
| D2 to D3 | 1.5 | |
| SI4 | D1 to D2 | 9.9 |
| D2 to D3 | -0.6 | |
| D3 to D4 | 7.6 | |
| D1 to D4 | 17.6 |
Table 7: Percentage increase between each irrigation and plant density treatments used in 2012 on-farm experiment, Halaba special Woreda, CRV, Ethiopia.
Comparison of on-farm experimental maize yield with the yield of neighboring farmers
Table 8 shows yield difference between on-farm research result and neighboring farmers. In our on-farm experiment we addressed the effect of supplemental irrigation and optimum planting density under optimum fertilizer application: all treatments were fully fertilized at 150% of the recommended amount.
Table 8 shows yield difference between on-farm research result and neighboring farmers. In our on-farm experiment we addressed the effect of supplemental irrigation and optimum planting density under optimum fertilizer application: all treatments were fully fertilized at 150% of the recommended amount.
Farmers own practice use half the amount of the recommended. The grain yield and total biomass difference between farmers own practice and our on-farm research was 101% and 84% respectively during 2012 and 61% for both grain yield and total biomass during the 2013 cropping season. The two years average (2012 & 2013) grain yield and total biomass difference between farmers own practice and our on-farm research was (101% + 61%)/2=81% and (84% + 61%/2) =72.5% respectively. The main factor for this yield difference between farmers own practice and research yield could be attributed to the amount of fertilizer applied.
| year | On-farm research | Farmers own practice | The difference between On-farm research and farmers own practice | |||
| 150 kg ha-1 fertilizer (Optimal fertilizer) | 50 kg ha-1 fertilizer (Half the recommended) | |||||
| Yield (Mg ha-1) | Biomass (Mg ha-1) | Yield (Mg ha-1) | Biomass (Mg ha-1) | Yield (%) | Biomass (%) | |
| 2012 | 7.45 | 15.81 | 3.70 | 8.60 | 101.4 | 83.8 |
| 2013 | 7.81 | 15.27 | 4.85 | 9.50 | 61.0 | 60.7 |
Table 8: On farm maize grain yield and total biomass in farmers’ fields (own practice) and in research-managed farmers’ fields with different rate of fertilizer application in Halaba special Woreda, CRV, Ethiopia.
Water productivity
In 2012 the highest water productivity was obtained at the SI2. For grain yield it is the SI2D2 combination that gave maximum water productivity of 2.0 kg m-3 and for dry matter it is the SI2D1 combination that gave maximum water productivity of 4.1 kg m-3 (Table 9). The lowest values were obtained from SI4 (full supplemental irrigation). For grain yield the lowest water productivity value was 1.3 kg m-3 obtained from the combination of SI4 with D1, D2 and D3 plant densities. For dry matter yield the lowest water productivity value was 2.8 kg m-3 obtained from the combination of SI4 with D1 plant density. So, the investment of the extra water is not worth the effort. In 2013 (without irrigation) the water productivity (both grain and dry matter) increased as the plant density level increases from D1 to D4, because since 2013 is a wet year increasing plant density helps to use the available water efficiently.
In 2012 the highest water productivity was obtained at the SI2. For grain yield it is the SI2D2 combination that gave maximum water productivity of 2.0 kg m-3 and for dry matter it is the SI2D1 combination that gave maximum water productivity of 4.1 kg m-3 (Table 9). The lowest values were obtained from SI4 (full supplemental irrigation). For grain yield the lowest water productivity value was 1.3 kg m-3 obtained from the combination of SI4 with D1, D2 and D3 plant densities. For dry matter yield the lowest water productivity value was 2.8 kg m-3 obtained from the combination of SI4 with D1 plant density. So, the investment of the extra water is not worth the effort. In 2013 (without irrigation) the water productivity (both grain and dry matter) increased as the plant density level increases from D1 to D4, because since 2013 is a wet year increasing plant density helps to use the available water efficiently.
| 2012 experiment- With SI* | water use | Y (grain) | Y (dry matter) | WP (grain) | WP (dry matter) | |
| (mm) | (Mg ha-1) | (Mg ha-1) | (kg m-3) | (kg m-3) | ||
| SI1 | D1 | 438 | 7.5 | 15.8 | 1.7 | 3.6 |
| SI2 | D1 | 411 | 7.8 | 16.8 | 1.9 | 4.1 |
| D2 | 435 | 8.5 | 16.8 | 2.0 | 3.9 | |
| SI3 | D1 | 477 | 8.2 | 17.6 | 1.7 | 3.7 |
| D2 | 501 | 8.9 | 18.9 | 1.8 | 3.8 | |
| D3 | 508 | 9.0 | 19.8 | 1.8 | 3.9 | |
| SI4 | D1 | 653 | 8.3 | 17.9 | 1.3 | 2.8 |
| D2 | 680 | 9.1 | 21.4 | 1.3 | 3.1 | |
| D3 | 674 | 9.1 | 19.9 | 1.3 | 3.0 | |
| D4 | 679 | 9.8 | 21.2 | 1.4 | 3.1 | |
| 2013 experiment- without SI | D1 | 703 | 7.8 | 15.3 | 1.1 | 2.2 |
| D2 | 635 | 8.0 | 16.7 | 1.3 | 2.6 | |
| D3 | 642 | 8.8 | 19.9 | 1.4 | 3.1 | |
| D4 | 643 | 9.6 | 22.5 | 1.5 | 3.5 | |
SI*= supplemental irrigation
Table 9: Crop water productivity at different combinations of supplemental irrigation and plant density during 2012 and 2013 in Halaba special Woreda, CRV, Ethiopia.
Table 9: Crop water productivity at different combinations of supplemental irrigation and plant density during 2012 and 2013 in Halaba special Woreda, CRV, Ethiopia.
Discussions
We conducted this study to prove that by using supplemental irrigation from water harvesting ponds together with improved soil fertility and optimum plant density, it is possible to reduce maize crop failure from extreme dry spells, thus improve food security. First we identified the risk of long dry spells occurrences in our experimental area using long term rainfall data (1970-2011). Then the potential of supplemental irrigation from water harvesting ponds was assessed. Finally an optimum combination of plant density and irrigation rate for grain yield, total biomass and water productivity was identified. To generate data for our study we used both on-farm experiments and available long term rainfall data. We measured the yield gap between farmers own practice and our on-farm experimental results.
Probability of dry spells
From the 42-year dry spell analysis, the probability of getting >10 consecutive dry days is more than 50% from March until May (Belg season). Dry spells exceeding 10 days are known to cause potentially yield-limiting water deficit to crops in East Africa (Barron et al., 2003; Segele and Lamb, 2005). Particularly 10-20 consecutive dry days during flowering can severely limit maize productivity (Biazin and Sterk, 2013; Muluneh et al. 2015).
From the 42-year dry spell analysis, the probability of getting >10 consecutive dry days is more than 50% from March until May (Belg season). Dry spells exceeding 10 days are known to cause potentially yield-limiting water deficit to crops in East Africa (Barron et al., 2003; Segele and Lamb, 2005). Particularly 10-20 consecutive dry days during flowering can severely limit maize productivity (Biazin and Sterk, 2013; Muluneh et al. 2015).
During July and August, the probability of getting >10 consecutive dry days is almost non-existent. This is consistent with previous studies in the area which reported 3-5 days of dry spells quite commonly occurring in the Kiremt season (mainly July and August) (Muluneh et al., 2015). Whereas dry spells greater than 10 days are limited to the lowland areas in western and north-eastern Ethiopia where rainfall variability is high (Segele and Lamb 2005). On the other hand, in September the probability of all dry spell lengths (>5 days, >10 days,> 15 days and >20 days) increased as a result of Kiremt season cessation. Therefore, late sowing of late maturing maize cultivar may face long dry spells in September that can negatively affect yield. Thus, for current climate, delayed planting of longer/ late maturing maize may not be desirable rather using supplemental irrigation is the best option.
Thus, long cycle maize sown during the Belg season and harvested around the end of Kiremt (September/October) always faces long dry spell during Belg (March-May) or most often during early Kiremt (June). In our 2012 experimental year there was >10 dry days during May and June which is consistent with the long term trend. But, the second year of the experiment (2013) was one of the wettest years in terms of seasonal total rainfall (983 mm) and in terms of short dry spell periods (< 10 days of dry spell).
Water supply
The question was: is there sufficient runoff that can be harvested in the farm ponds and used for SI for maize during drought years? In the study area, most farmers allocate about 0.5 ha of land for maize crop (Gebremedhin et al., 2007). As water harvesting catchment, we took the 2.2 ha, which is the size of the catchment area that feeds runoff to our experimental farm ponds. The size of catchments for household RWH systems in Ethiopia in general ranges between 1 and 2 ha. In Ethiopia average capacity of farm ponds is about 65 m3 and the catchment area varies from 0.4 to 2.5 ha (Wakeyo & Gardebroek, 2013). In our study area, after we compared, the crop water requirement (calculated with FAO/Allen method) with the potential runoff, we find out that there is sufficient runoff that can be harvested in the farm ponds and used for supplemental irrigation for maize during drought years (Table 4). Hartog (2012) similarly reported the possibility of irrigating 0.3-0.8 ha of maize field between May-July using water harvesting ponds with the capacity of 350 m3 volume of water. Other evidences also indicate that supplemental irrigation ranging from 50-200 mm per season (500-2000 m3 ha-1) is sufficient to mediate yield reducing dry spells in most years and rainfed systems, and thereby stabilize and optimize yield levels (Wani & Ramakishna, 2005).
The question was: is there sufficient runoff that can be harvested in the farm ponds and used for SI for maize during drought years? In the study area, most farmers allocate about 0.5 ha of land for maize crop (Gebremedhin et al., 2007). As water harvesting catchment, we took the 2.2 ha, which is the size of the catchment area that feeds runoff to our experimental farm ponds. The size of catchments for household RWH systems in Ethiopia in general ranges between 1 and 2 ha. In Ethiopia average capacity of farm ponds is about 65 m3 and the catchment area varies from 0.4 to 2.5 ha (Wakeyo & Gardebroek, 2013). In our study area, after we compared, the crop water requirement (calculated with FAO/Allen method) with the potential runoff, we find out that there is sufficient runoff that can be harvested in the farm ponds and used for supplemental irrigation for maize during drought years (Table 4). Hartog (2012) similarly reported the possibility of irrigating 0.3-0.8 ha of maize field between May-July using water harvesting ponds with the capacity of 350 m3 volume of water. Other evidences also indicate that supplemental irrigation ranging from 50-200 mm per season (500-2000 m3 ha-1) is sufficient to mediate yield reducing dry spells in most years and rainfed systems, and thereby stabilize and optimize yield levels (Wani & Ramakishna, 2005).
An inherent limitation of RWH systems is that they can only provide supplemental irrigation water in or near to the rainy season and may not deliver the required quantities at the time it is most critically needed.
Seasonally there is >4 times more runoff water that can be harvested from 2.2 ha catchment area (1670 m3) than the water required for supplemental irrigation (356 m3). Most of this surplus runoff is collected during the Kiremt (July and August) (Table 4). Therefore, runoff water can also be used for domestic uses for farmers since ponds lined with concrete can retain captured water up to three months after the rainy season. In Ethiopia, the surface of ponds is often sealed with cement concrete, plastic or clay so that they can hold water for a relatively long time (Wakeyo & Gardebroek, 2013). In this study we did not consider other uses of water from the water harvesting ponds such as supplemental irrigation of high value crops, domestic use etc. that can compete for a significant amount of water. There can also be losses of runoff before it reaches to the ponds like overtopping of the sediment trap (Figure 2) and other agricultural practices that decrease run-off (like shilshalo) and decrease the efficiency of water harvesting ponds.
The effect of supplemental irrigation
During the 2012 on-farm experiment, there were ten different combinations of supplemental irrigation and plant density. Statistically significant grain and biomass yield was observed between rainfed and all other irrigation levels and between SI2 and SI3 but the grain yield between SI3 toSI4 remained almost level. Grain yield increased 31 % from rainfed and 30,000 plants to non-stressed supplemental irrigation and 75,000 plants. The maximum yield increase which could be attributed solely to supplemental irrigation was 12%.
During the 2012 on-farm experiment, there were ten different combinations of supplemental irrigation and plant density. Statistically significant grain and biomass yield was observed between rainfed and all other irrigation levels and between SI2 and SI3 but the grain yield between SI3 toSI4 remained almost level. Grain yield increased 31 % from rainfed and 30,000 plants to non-stressed supplemental irrigation and 75,000 plants. The maximum yield increase which could be attributed solely to supplemental irrigation was 12%.
The year 2012 was one of the drought years in terms of total seasonal rainfall (March-September) due to the very low Belg (March-May) rainfall. However, during the critical growth stages of maize which is flowering and grain filling (July and August) there were no long dry spells. The dry spells that occurred were during May and June which were the vegetative stages of maize. Therefore, the year 2012 was not critical drought year rather it was moderate drought year.
Yield increase from supplemental irrigation varies on the growth stage when the crop is exposed to moisture stress. To use supplemental irrigation efficiently, it is essential to have knowledge of the impact of water shortage during critical crop growing stages.
The effect of increased plant density
Increasing plant density from what farmers currently is using 30,000 plants ha-1 to 75,000 plants ha-1 increases grain yield by about 18% (Table 6) which is also statistically significant. However, the subsequent increase of plant density from 30,000 to 45,000 and 60,000 plants ha-1 didn’t bring statistically significant yield increase. Therefore, we would advise farmers to use the highest plant density (75,000 plants ha-1). A similar study conducted in Sri Lanka by Malaviarachchi et al. (2007) under supplemental irrigation and fully fertilized maize showed a 33% grain yield increase when the plant density increased from 55,000 to 110,000 plants ha-1. Generally, existing studies indicated that maize plant density for maximum grain yield varies from 30,000 to over 90,000 plants ha-1 (Olson & Sanders, 1988).
Increasing plant density from what farmers currently is using 30,000 plants ha-1 to 75,000 plants ha-1 increases grain yield by about 18% (Table 6) which is also statistically significant. However, the subsequent increase of plant density from 30,000 to 45,000 and 60,000 plants ha-1 didn’t bring statistically significant yield increase. Therefore, we would advise farmers to use the highest plant density (75,000 plants ha-1). A similar study conducted in Sri Lanka by Malaviarachchi et al. (2007) under supplemental irrigation and fully fertilized maize showed a 33% grain yield increase when the plant density increased from 55,000 to 110,000 plants ha-1. Generally, existing studies indicated that maize plant density for maximum grain yield varies from 30,000 to over 90,000 plants ha-1 (Olson & Sanders, 1988).
Water productivity
The lower values of water productivity at SI4 indicate that the use of SI4 supplemental irrigation is not as efficient in terms of water use as compared to SI2. This is in line with other studies which show a decrease in WP as the amount of supplemental irrigation increased (Zwart & Bastiaanssen, 2004). Overall the grain water productivity in this study is by far greater than the farmers own practice grain water productivity 1.14 kg m-3. However, it remains within the range of globally measured WP (grain) values 1.1-2.7 kg m-3 with average WP (grain) of 1.80 kg m-3 which was reported after synthesizing 84 literature sources by Zwart & Bastiaanssen (2004). In our study, the relatively higher WP obtained as compared to farmers practice could be mainly attributed to the use of optimum fertilizer that significantly increased the yield.
The lower values of water productivity at SI4 indicate that the use of SI4 supplemental irrigation is not as efficient in terms of water use as compared to SI2. This is in line with other studies which show a decrease in WP as the amount of supplemental irrigation increased (Zwart & Bastiaanssen, 2004). Overall the grain water productivity in this study is by far greater than the farmers own practice grain water productivity 1.14 kg m-3. However, it remains within the range of globally measured WP (grain) values 1.1-2.7 kg m-3 with average WP (grain) of 1.80 kg m-3 which was reported after synthesizing 84 literature sources by Zwart & Bastiaanssen (2004). In our study, the relatively higher WP obtained as compared to farmers practice could be mainly attributed to the use of optimum fertilizer that significantly increased the yield.
Planting time
Planting time is an important water management instrument. April is the month where the Belg season rainfall (March-April) normally reaches peak. That is why the long term average onset of the rainfall season in the CRV region is in April (Muluneh et al., 2015). However, though April has relatively high rainfall still there is a high probability of long dry spells (Figure 3). Most farmers often sow maize in April, but the subsequent long dry spells during April, May and June leads to risk of low yield or crop failure. The other likely risk of sowing maize in April is that, the moisture sensitive stages of maize could coincide with long dry spell months of May and June. So, later sowing of maize (e.g May) in the CRV could reduce risk of long dry spells. For example, in our 2012 and 2013 experimental years where the sowing of maize was early and late May respectively, there was no critical moisture stress during critical maize growth stages (during flowering and grain filling). So, we recommend a later sowing for maize in the CRV. Similar argument has been given by Biazin & Sterk (2013) who reported a higher simulated yield in response to sowing in May as compared to early sowing in April. The effect is likely attributed to the lower probability of long dry spells between mid-July and mid-August which are the flowering and grain-filling stages of the local maize that is planted in May in the semi-arid part of CRV. Similarly, Biazin & Sterk (2013) suggested late season cropping of maize to be encouraged with rainfed supplemental irrigation to reduce drought in case of rain failure.
Planting time is an important water management instrument. April is the month where the Belg season rainfall (March-April) normally reaches peak. That is why the long term average onset of the rainfall season in the CRV region is in April (Muluneh et al., 2015). However, though April has relatively high rainfall still there is a high probability of long dry spells (Figure 3). Most farmers often sow maize in April, but the subsequent long dry spells during April, May and June leads to risk of low yield or crop failure. The other likely risk of sowing maize in April is that, the moisture sensitive stages of maize could coincide with long dry spell months of May and June. So, later sowing of maize (e.g May) in the CRV could reduce risk of long dry spells. For example, in our 2012 and 2013 experimental years where the sowing of maize was early and late May respectively, there was no critical moisture stress during critical maize growth stages (during flowering and grain filling). So, we recommend a later sowing for maize in the CRV. Similar argument has been given by Biazin & Sterk (2013) who reported a higher simulated yield in response to sowing in May as compared to early sowing in April. The effect is likely attributed to the lower probability of long dry spells between mid-July and mid-August which are the flowering and grain-filling stages of the local maize that is planted in May in the semi-arid part of CRV. Similarly, Biazin & Sterk (2013) suggested late season cropping of maize to be encouraged with rainfed supplemental irrigation to reduce drought in case of rain failure.
The role of soil fertility
The yield gaps between farmers own practice and our on-farm research (Table 8) were attributed to the difference in the amount of fertilizer use. Fertilizer use plays a significant and positive effect on maize grain yield. Some indicate that a 1% increase of fertilizer use per hectare on maize, increases yield by 6% (Gebremedhin et al., 2007). The farmers own practice yield in our study also looks higher than the yield reported by other previous studies in the same region. For example, Kassie et al. (2014) for example reported an average farmers maize yield of 2.0-2.3 Mg ha-1 in the CRV. One of the reasons for such variation of yields could be due to the different rate of fertilizer use by farmers. Farmers normally use different rates of fertilizer in the region like 25 kg ha-1, 50 kg ha-1and including farmers that do not use fertilizer at all due to fear of crop failure from drought or because they cannot afford to buy.
The yield gaps between farmers own practice and our on-farm research (Table 8) were attributed to the difference in the amount of fertilizer use. Fertilizer use plays a significant and positive effect on maize grain yield. Some indicate that a 1% increase of fertilizer use per hectare on maize, increases yield by 6% (Gebremedhin et al., 2007). The farmers own practice yield in our study also looks higher than the yield reported by other previous studies in the same region. For example, Kassie et al. (2014) for example reported an average farmers maize yield of 2.0-2.3 Mg ha-1 in the CRV. One of the reasons for such variation of yields could be due to the different rate of fertilizer use by farmers. Farmers normally use different rates of fertilizer in the region like 25 kg ha-1, 50 kg ha-1and including farmers that do not use fertilizer at all due to fear of crop failure from drought or because they cannot afford to buy.
The yield difference between 2012 and 2013 from farmers own practice could be due to low rainfall and a dry spell during early stage of crop growth during 2012 and high rainfall with less than 5 dry days during 2013, which was one of the wettest years in almost 40 years period.
Thus, applying optimum fertilizer during good rainfall years is a possibility of increasing maize yield by more than half from what they are producing now. Some argue that nutrient supply, rather than water, is the main yield-limiting factor in sub-Saharan Africa (Breman & Debrah, 2003). Even in low and irregular rainfall conditions, the low fertility of the soils is often considered much more a limiting factor than water (Tittonell & Giller, 2013). Similarly, in maize growing areas of Ethiopia soil fertility is considered one of the principal factors that limit maize productivity. However, for sustainable yield increase an integrated approach is important which includes supplemental irrigation and fertilizer.
Benefits of increased dry matter
For farmers in the CRV, where mixed crop-livestock farming is their means of livelihood, crop improvement to increase grain yields and biomass can help to secure both human food and animal feed. Livestock plays an important role in providing draft power, cash and food. The feed sources commonly used for livestock, depend on natural grazing and crop residues. Due to a shortage of grazing land most farmers depend on plant residues for their animals. Thus, the 84% and 61% increase in total above ground biomass between on-farm research and farm practice provide additional advantage for farmers as a source of animal feed.
For farmers in the CRV, where mixed crop-livestock farming is their means of livelihood, crop improvement to increase grain yields and biomass can help to secure both human food and animal feed. Livestock plays an important role in providing draft power, cash and food. The feed sources commonly used for livestock, depend on natural grazing and crop residues. Due to a shortage of grazing land most farmers depend on plant residues for their animals. Thus, the 84% and 61% increase in total above ground biomass between on-farm research and farm practice provide additional advantage for farmers as a source of animal feed.
Studies have also indicated that in east Africa particularly in the CRV of Ethiopia, crop-livestock mixed farming is considered as a better strategy for coping climate change impact in the future (Birhanu & Sterk, 2013). Application of maize straw residues with sufficient N fertilizer can also improve the soil biological properties and also favors the appearance of spontaneous vegetation, which will protect the soil and will contribute to its restoration.
Financial feasibility
The financial feasibility of RWH ponds for supplemental irrigation was assessed by Hartog (2012) in the same area. The analysis includes the initial investment for constructing farm ponds, maintenance costs and a drip kit for irrigation. The analysis showed that, for construction of farm ponds and irrigating maize to be financially feasible, the productivity of maize need to be 1.18 Mg ha-1 more than what farmers are currently getting (2.0-2.3 Mg ha-1) (Kassie et al., 2014) ( Table 3). In our experiment, the maximum yield increase which could be attributed solely to supplemental irrigation during non-critical drought year was 12%. This yield increase from only SI is not financially feasible to use SI from farm ponds, which indicates that investment in supplemental irrigation during non-critical drought years is probably not worth the effort. But, using optimum fertilizer even without SI during non-critical drought year (e.g. 2012) maize grain yield increased by more than half (Table 8). Given the variability of the Ethiopian market value of goods/items market value estimations could be significantly variable by time.
The financial feasibility of RWH ponds for supplemental irrigation was assessed by Hartog (2012) in the same area. The analysis includes the initial investment for constructing farm ponds, maintenance costs and a drip kit for irrigation. The analysis showed that, for construction of farm ponds and irrigating maize to be financially feasible, the productivity of maize need to be 1.18 Mg ha-1 more than what farmers are currently getting (2.0-2.3 Mg ha-1) (Kassie et al., 2014) ( Table 3). In our experiment, the maximum yield increase which could be attributed solely to supplemental irrigation during non-critical drought year was 12%. This yield increase from only SI is not financially feasible to use SI from farm ponds, which indicates that investment in supplemental irrigation during non-critical drought years is probably not worth the effort. But, using optimum fertilizer even without SI during non-critical drought year (e.g. 2012) maize grain yield increased by more than half (Table 8). Given the variability of the Ethiopian market value of goods/items market value estimations could be significantly variable by time.
Conclusions
- Our long term daily rainfall (1970-2011) analysis proves the occurrence of long dry spells during the maize cropping season mainly during the months of the Belg season.
- The fact that the grain yield increase from SI3 to SI4 was insignificant and the water productivity of SI4 is the least of all treatments indicates that the SI4 situation probably is too wet and undesirable.
- Since there was a significant yield increase as the plant density increases from 30,000 plants ha-1 to 75,000 plants ha-1 (D1 to D4), we advise farmers to use higher plant density (75,000 plants ha-1).
- The large yield gap between on-farm research and farmers practice is contributed to the higher use of fertilizer. So, our experiment, once again, suggests that yield lower than attainable is not a matter of water shortage but more superior effect of fertilizer.
- With our 2 years experiment we could not prove the response of supplemental irrigation during critical drought years.
- When we compare the volume of water required to the volume water that can be harvested, supplemental irrigation is technically feasible to irrigate 0.5 ha of maize field. However, supplemental irrigation is not financially feasible during non-critical drought years (like in the year 2012).
Acknowledgments
The authors are grateful to the Netherlands Organization for International Cooperation in Higher Education (NUFFIC) and International Foundation for Science (IFS) for supporting the research financially. The authors are also grateful to the farmers of Guba kebele, in Halaba special Woreda who voluntarily made their fields available for field experimentation during the 2012 and 2013 growing seasons.
The authors are grateful to the Netherlands Organization for International Cooperation in Higher Education (NUFFIC) and International Foundation for Science (IFS) for supporting the research financially. The authors are also grateful to the farmers of Guba kebele, in Halaba special Woreda who voluntarily made their fields available for field experimentation during the 2012 and 2013 growing seasons.
References
- Allen RG., et al. “Crop evapotranspiration. Guidelines for computing crop water requirements”.FAO Irrigation and drainage paper 56 (1998):
- Barron J. “Dry spell mitigation to upgrade semi-arid rainfed agriculture: Water harvesting and soil nutrient management for smallholder maize cultivation in Machakos, Kenya”. Ph.D. thesis in Natural Resources Management. Department of Systems Ecology, Stockholm University, Sweden (2004):
- Barron J., et al. “Dry spell analysis and maize yields for two semi-arid locations in east Africa”. Agricultural and Forest Meteorology 117.1-2 (2003): 23-37.
- Biazin B and Sterk G. “Drought vulnerability drives land-use and land cover changes in the Rift Valley dry lands of Ethiopia”. Agriculture, Ecosystems & Environment 164 (2013): 100-113.
- Breman H and Debrah SK. “Improving African food security”. SAIS Review 23 (2003): 153-170.
- Debelle T., et al. “A review of fertilizer management research on maize in Ethiopia. Nigussie, M., Tanner, D., Twumasi-friyie, S. (Eds.), Enhancing the contribution of maize to food security in Ethiopia”. Proceedings of the second national maize workshop of Ethiopia (2001): 46-55.
- “Ethiopian Institute of Agricultural Research (EIAR), (2004). Directory of Released Crop Varieties and Their Recommended Cultural Practices. Addis Ababa, Ethiopia”. (2004):
- Fox P and Rockström J. “Supplemental irrigation for dry-spell mitigation of rainfed agriculture in the Sahel”. Agricultural Water Management 61.1 (2003): 29-50.
- Gebremedhin B., et al. “Maize and livestock: Their inter-linked roles in meeting human needs in Ethiopia”. International Livestock Research Institute (2007): 103.
- Hartog M. “Rain on the menu: Rainwater harvesting for small-scale irrigation of maize in the Central Rift Valley, Ethiopia”. MSc thesis, International Land and Water Management, Wageningen University(2012):
- Hawkins RH., et al. “Runoff Curve Number Method: Examination of the Initial Abstraction Ratio. In: Proceedings of the Second Federal Interagency Hydrologic Modelling Conference, Las Vegas, Nevada. U.S. Geological Survey, Lakewood, Colorado.CD-ROM”. (2002):
- Kassie BT., et al. “Climate-induced yield variability and yield gaps of maize (Zea mays L.) in the Central Rift Valley of Ethiopia". Field Crops Research 160 (2014): 41-53.
- Krause PB., et al. “Comparison of different efficiency criteria for hydrological model assessment”. Advanced Geosciences 5 (2005): 89-97.
- Malaviarachchi MAPWK., et al. “Influence of plant density on yield of hybrid maize (Zea mays L.) under supplemental irrigation”. The Journal of Agricultural Science 3 (2007): 58-66.
- Martin DL., et al. “Irrigation scheduling principles. In: Management of Farm Irrigation Systems, ASAE Mono., G. J. Hoffman, T. A. Howell,and K.H. Solomon, (Eds.), ASAE, St. Joseph, Michigan”. (1990): 155-203.
- Monneveux P., et al. “Population density and low nitrogen affects yield - Associated Traits in Tropical Maize”. Crop Science 45.2 (2005): 535-545.
- Muluneh A., et al.“Impact of predicted changes in rainfall and atmospheric carbon dioxide on maize and wheat yields in the Central Rift Valley of Ethiopia”. Regional Environmental Change15.6 (2015): 1105-1119.
- Nash JE and Sutcliffe JV. “River flow forecasting through conceptual models, Part I - A discussion of principles”. Journal of Hydrology 10.3 (1970): 282-290.
- Olson RA and Sanders DH. “Maize production. In: Sprague, G.F. Dudley, J.W. Corn and corn improvement”. American Society of Agronomy 11 (1988): 639-686.
- Panda RK., et al. “Effective management of irrigation water for maize under stressed conditions”. Agricultural Water Management 66.3 (2004): 181-203.
- Recha CW., et al. “Socio-economic determinants of adoption of rainwater harvesting and conservation techniques in semiarid Tharaka sub-county, Kenya”. Land Degradation & Development(2014):
- Rockström J., et al.“Water productivity in rainfed agriculture: challenges and opportunities for smallholder farmers in drought prone tropical agro-ecosystems. In: Kijne JW, Barker R, Molden D (eds) Water productivity in agriculture: limits and opportunities for improvements”. CABI, Wallingford(2003):
- Sangoi L. “Understanding plant density effects on maize growth and development: an important issue to maximize grain yield”. Ciência Rural31 (2000): 159-168.
- Segele ZT and Lamb PJ. “Characterization and variability of Kiremt rainy season over Ethiopia”. Meteorology and Atmospheric Physics 89.1-4 (2005): 153-180.
- SCS (Soil Conservation Service). “SCS National Engineering Handbook, Section 4. Hydrology, Soil Conservation Service”. US Department of Agriculture, Washington (1972):
- Seckler D and Amarasinghe U. “Water supply and demand, 1995 to 2025. In International Water Management Institute (IWMI), Annual report 1999-2000. Colombo, Sri Lanka: IWMI”. (2000): 9-17.
- Shi ZH., et al. “Research on the SCS-CN initial abstraction ratio using rainfall–runoff event analysis in the Three Gorges area, China”. Catena77.1 (2009): 1-7.
- Sime G and Aune J. “Sequential effects of minimum tillage, seed priming, fertilizer micro dosing and mulching in maize, semiarid central rift valley of Ethiopia”. Experimental Agriculture 52.3 (2015): 331-345.
- Stern R., et al. “Instat climatic guide. Statistics Services Center, University of Reading, UK”. (2006): 247-281.
- Tittonell P and Giller K. “When yield gaps are poverty traps: The paradigm of ecological intensification in African smallholder agriculture”. Field Crops Research 143 (2013): 76-90.
- Tollenaar M., et al. “Grain yield is reduced more by weed interference in an old than in a new maize hybrid”. Agronomy Journal 89.2 (1997): 239-246.
- Wani SP and Ramakrishna YS. “Sustainable management of rainwater through integrated watershed approach for improved rural livelihoods. In Watershed Management Challenges: Improving Productivity, Resources and Livelihoods. ed. Sharma, B. R.; Samra, J. S.; Scott, C. A.; Wani, S. P. International Water Management Institute, Colombo, Sri Lanka”. (2005): 39-60.
- Zwart SJ and Bastiaanssen WGM. “Review of measured crop water productivity values for irrigated wheat, rice, cotton and maize”. Agricultural Water Management 69.2 (2004): 115-133.
Citation:
Alemayehu Muluneh., et al. “Increasing Maize Yield through Crop Intensification in the Central Rift Valley of Ethiopia”. Innovative Techniques in Agriculture 3.4 (2019): 706-727.
Copyright: © 2019 Alemayehu Muluneh., et al. This is an open-access article distributed under the terms of the Creative Commons Attribution License, which permits unrestricted use, distribution, and reproduction in any medium, provided the original author and source are credited.
 Scientia Ricerca is licensed and content of this site is available under a Creative Commons Attribution 4.0 International License.