Review Article
Volume 4 Issue 1 - 2020
Diabetes: Insulin Resistance
Department of Physical Education, Federal University of Paraná, Curitiba - PR, Brazil
*Corresponding Author: Maria Gisele Dos Santo, Department of Physical Education, Federal University of Paraná, Curitiba - PR, Brazil.
Abstract
In the years prior to the onset of DM2 symptoms, despite insulin resistance being observed, there is an increase in insulin secretion, that is, compensatory hyperinsulinimia, maintaining normal glycemic concentrations until dysfunctions occur in beta cells and inability to control glycemia thus leading diagnosis of DM2 (CEFALU, 2001).
Introduction
Different researchers have observed that subjects with insulin resistance show changes in energy metabolism. [1] Showed that in overweight women the insulin resistant group oxidized less carbohydrates than the control group [2]. Observed in type 2 diabetics, obese, a reduction in the oxidation of plasma fatty acids, but without differences in the total oxidation of fats and carbohydrates, when compared to the control group. In another study [3] studied non-obese type 2 diabetic patients. In this study, no changes were found in the oxidation of fats or carbohydrates. It should be noted in the last two studies cited that the subjects were type 2 diabetic, therefore, hyperglycemic. A characteristic common to almost all studies that measured the substrate balance in subjects with insulin resistance, diabetes and obesity was the use of fixed percentages of VO2 max to control the intensity. However studies have shown great inter-individual differences in the use of fats during exercise [4]. Observed that bottom cyclists reached the maximum fat oxidation rate (Fat max) at intensities that ranged from 42 to 84% (64 ± 4%) of VO2 max [5] also measured the fat max of triathletes and cyclists and related it to plasma lactate. Fat max was found at an intensity of 63 ± 9% and the lactate threshold at 61 ± 5%, with no significant differences between the two. Although the Fat max variation was not reported in the study, it was probably greater than that observed in the previous study due to the high standard deviation, once again highlighting the inter-individual differences in this variable. Given these results it can be speculated that it is possible that the maximum rate of oxidation of fats occurs at different intensities in people resistant to insulin, but the absolute oxidation of fats and carbohydrates is not different from that of people sensitive to insulin, when the intensity of exercise is controlled by the maximum fat oxidation rate or by the anaerobic threshold. The study by [6] supports this hypothesis. In this study, it was observed that the crossover point (point where the relative contribution of carbohydrate metabolism exceeds that of fat in energy production) occurred at significantly lower intensities in overweight subjects when compared to subjects with normal weight and the maximum rate of Fat oxidation also occurred at significantly lower intensities. However, to date, there are no studies showing whether it occurs.
Insulin Resistance
[7] Insulin resistance is defined as a medical condition in which normal or elevated insulin concentration produces an attenuated biological response. Such abnormality occurs mainly due to the defective action of insulin in peripheral tissues sensitive to insulin such as: adipose, muscular and hepatic tissue [8].
[7] Insulin resistance is defined as a medical condition in which normal or elevated insulin concentration produces an attenuated biological response. Such abnormality occurs mainly due to the defective action of insulin in peripheral tissues sensitive to insulin such as: adipose, muscular and hepatic tissue [8].
Insulin Signaling Mechanisms
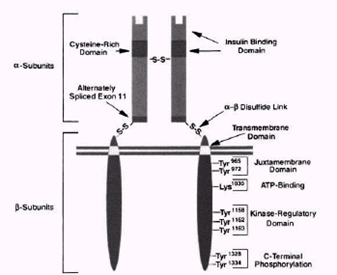
Insulin triggers several metabolic processes in cells by binding to receptors on the cell surface. Such receptors are found in tissues classically sensitive to insulin such as muscle, liver and adipocytes and also in tissues that are traditionally seen as non-insulin sensitive such as the brain, erythrocytes and gonads. [9]. The insulin receptor is a heterotetrametric protein with kinase activity, composed of two subunits and two, linked by disulfide bridges forming a Figure 2.1) . The subunit contains the insulin binding domain, while the subunit has insulin-stimulated tyrosine kinase activity [10].
Insulin triggers several metabolic processes in cells by binding to receptors on the cell surface. Such receptors are found in tissues classically sensitive to insulin such as muscle, liver and adipocytes and also in tissues that are traditionally seen as non-insulin sensitive such as the brain, erythrocytes and gonads. [9]. The insulin receptor is a heterotetrametric protein with kinase activity, composed of two subunits and two, linked by disulfide bridges forming a Figure 2.1) . The subunit contains the insulin binding domain, while the subunit has insulin-stimulated tyrosine kinase activity [10].
When insulin binds to the sub subunit of the receptor, it causes conformational changes in the receptor, leading to stimulation of the kinase activity of the unidade subunit. Once the sub subunit is activated, it auto phosphorylates in at least six tyrosine sites. Following activation, the insulin receptor stimulates the transfer of phosphate groups to tyrosine on intracellular substrates of the receptor [9]. The first substrate to be characterized was called the insulin receptor substrate 1 (IRS-1). Currently, ten insulin receptor substrates have been identified [11], among them IRS-1, IRS-2, IRS-3, Gab-1 and SHC. Spread by the IRS are several tyrosine phosphorylation sites activated by insulin stimulation. This phosphorylation of the IRS allows it to bind to certain proteins, among which stands out an enzyme called phosphatidylinositol 3-kinase (PI 3-kinase) which is considered the major link between IRS1 and the metabolic effects of insulin [9] and the only intracellular molecule considered essential for the transport of glucose [12]. PI 3-kinase consists of two subunits: a regulatory one (p85) that allows its connection to the IRS and a catalytic one (p110). The activation of PI 3-kinase is associated with the triggering of several metabolic processes such as increased GLUT-4 translocation for glucose uptake, glycogen synthesis and protein synthesis.
Glucose uptake by cells
One of the processes triggered in the cell by the action of insulin is the uptake of blood glucose. To enter cells, glucose must be carried by specific transporters. These transporters are called GLUT (glucose transporter) and consist of a group of 5 transmembrane proteins: GLUT 1, 2, 3, 4 and 5 that are found in different tissues [13]:
One of the processes triggered in the cell by the action of insulin is the uptake of blood glucose. To enter cells, glucose must be carried by specific transporters. These transporters are called GLUT (glucose transporter) and consist of a group of 5 transmembrane proteins: GLUT 1, 2, 3, 4 and 5 that are found in different tissues [13]:
- GLUT 1 - Widely expressed; high concentrations in the brain, erythrocytes and endothelial cells. It is the constitutive glucose transporter.
- GLUT 2 - Found in the kidneys, small intestine, epithelium, liver and β-pancreatic cells. It has low glucose affinity and plays a role in modulating pancreatic islets to glucose concentration.
- GLUT 3 - Found in neurons and placenta. It has a high affinity for glucose.
- GLUT 4 - Found in skeletal muscle, cardiac muscle and adipose tissue. It is the insulin-responsive glucose transporter.
- GLUT 5 - Found in the small intestine, sperm, kidneys, brain, and fat and muscle tissue. It is the fructose transporter and has a low affinity for glucose.
The only insulin-dependent glucose transporter to perform its action is GLUT 4. As seen, this transporter is found mainly in muscles and adipose tissue, and as muscle is the main tissue responsible for the uptake of blood glucose the action of insulin becomes of great importance for the maintenance of blood glucose. In the absence of a stimulus such as insulin (or exercise), approximately 90% of GLUT 4 is stored within specific intracellular vesicles. In the presence of a stimulus, GLUT 4 moves out of these vesicles, Trans locating to the cell surface and connecting to the membrane to capture glucose [12, 13]. In the case of glucose uptake stimulated by insulin, GLUT 4 translocation occurs due to the activation of PI 3-kinase, however studies have shown that exercise has a stimulating effect on GLUT 4 translocation even in the absence of insulin. [14] Observed, for the first time, in muscles isolated from rats submitted to electro stimulation that glucose uptake increased by up to 5 times, regardless of the presence of insulin, contrary to what was believed until then, that a minimum of insulin would be needed for the increase in glucose uptake observed during muscle contraction. In another study [15] also using muscles of rats, it was demonstrated that both insulin and muscle contraction stimulated glucose uptake via GLUT 4. In the same study, the authors raised the hypothesis that there are two "pools" different from GLUT 4, one sensitive to insulin and the other sensitive to contraction. In a study with humans, [16] studied the translocation of GLUT 4 after a session of 45 to 60 minutes of exercise on a cycle ergometer at 60 to 70% of VO2max in normal subjects with DM2. The content of GLUT 4 present in the membrane increased by 74 ± 20% in patients with DM2 and 71 ± 18% in normal subjects. These results showed that despite defects in the mechanisms responsible for glucose uptake via insulin, DM2 patients are responsive to exercise-induced GLUT 4 translocation. Since the translocation of GLUT 4 into skeletal muscle, via the insulin-dependent mechanism, is mediated by the activation of PI-3 kinase, this pathway is
Mechanisms Involved in Insulin Resistance
Insulin resistance occurs when circulating insulin concentrations are not sufficient to properly regulate its processes, resulting from a defect in signal transduction [17]. Although the specific cause of insulin resistance is unknown, it is known that problems in lipid metabolism, and in particular an increase in the availability of lipids, are strongly related, suggesting that the increase in the availability of lipids may upset the interaction between fat metabolism and carbohydrates [18].
Insulin resistance occurs when circulating insulin concentrations are not sufficient to properly regulate its processes, resulting from a defect in signal transduction [17]. Although the specific cause of insulin resistance is unknown, it is known that problems in lipid metabolism, and in particular an increase in the availability of lipids, are strongly related, suggesting that the increase in the availability of lipids may upset the interaction between fat metabolism and carbohydrates [18].
It is known that in addition to hyperglycemia, the individual with DM2 almost invariably presents disturbances in fat metabolism, often reflected by high concentrations of circulating FFA and TAG, in addition to excessive fat deposition in various tissues, including muscle [19]. An example of this are several studies that have shown a strong correlation between intramiocellular triglycerides and insulin resistance [20]. Studied young adults with normal weight, using Proton Magnetic Resonance Spectroscopy (1H-ERM) for the determination of intramiocellular triglycerides and the euglycemic-hyperinsulinemic clamp for the determination of insulin sensitivity. The authors found a correlation of r = -0.692 between the two parameters (Figure 2).
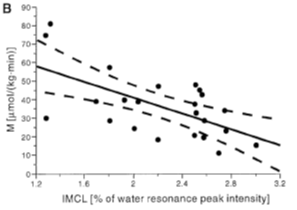
Figure 2: Correlation between insulin sensitivity and the content of intramiocellular triaglycerides
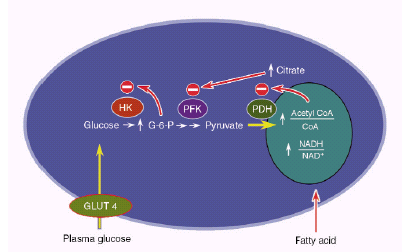
In another study [21] using the same techniques as the previous study showed that children of DM2 patients had significantly higher concentrations of intramiocellular triglycerides and insulin resistance than subjects without a family history of DM2. This increase in intramiocellular triglyceride content seems to be associated with a reduction in insulin receptor phosphorylation and in Pi 3-kinase activity associated with IRS-1 [22]. Several hypotheses have been raised to explain the mechanism by which high concentrations of lipids could cause insulin resistance, the best known being the glucose-fatty acid cycle proposed by Randle in 1963 (Figure 3). According to this hypothesis, an increase in fatty acid concentrations results in an increase in the intramitochondrial proportions of acetyl CoA / CoA and NADH / NAD + leading to a deactivation of the enzyme pyruvate dehydrogenase, an increase in citrate concentrations and inhibiting phosphofrutokinase, a key enzyme in the control glucose. Increases in glucose-6-phosphate concentrations would inhibit the activity of the hexokinase II enzyme, resulting in an increase in intracellular glucose concentrations and thus decreasing glucose uptake [23].
Recent studies using Magnetic Resonance Spectroscopy (ERM) have proposed an alternative hypothesis to the fatty acid glucose cycle. [24] Observed with a lipid infusion, in contrast to the Randle cycle, a drop in glucose-6-phosphate concentrations accompanied by a ~ 40% reduction in glucose oxidation. In another study [25] measured, using 13C ERM (carbon magnetic resonance spectroscopy), intracellular glucose concentrations after lipid infusion. The authors found a significant reduction in intracellular glucose concentrations after lipid infusion, showing that hexokinase II activity was not reduced, which again goes against the Randle mechanism. The authors argue that such findings suggest that the infusion of lipids caused insulin resistance through an inhibition of glucose transport activity, since in the same study, a reduction in the activity of IRS-1 associated with PI 3-kinase was observed.
From these studies, the following mechanism was proposed (Figure 4), by which the increased availability of fatty acids could induce insulin resistance [23].
An increase in the availability of fatty acids to the cell or a reduction in the intracellular metabolism of fatty acids leads to an increase in their quantity and their metabolites (diacylglycerol, fatty acyl CoA and ceramides). These metabolites activate a cascade of phosphorylation in serine and threonine of the insulin receptor substrates (IRS1, IRS2), probably triggered by the protein kinase tetha. The phosphorylation of insulin receptor substrates in serine and threonine reduces its activation action of PI 3-kinase, thus reducing the effects of insulin such as glucose transport [23].
References
- Braun B., et al. “Effects of insulin resistance on substrate utilization during exercise in overweight women”.Journal of Applied Physiology 97.3(2004): 991-997.
- Blaak EE., et al. “Impaired oxidation of plasma-derived fatty acids in type 2 diabetic subjects during moderate-intensity exercise”. Diabetes 49.12(2000): 2102-2107.
- Borghouts LB., et al. “Substrate utilization in non-obese Type II diabetic patients at rest and during exercise”. Clinical Science 103.6(2002): 559-566.
- ACHTEN J., et al. “Determination of the exercise intensity that elicits maximal fat oxidation”. Medicine & Science in Sports & Exercise 34.1(2002): 92-7.
- Achten J and Jeukendrup AE. “Relation between plasma lactate concentration and fat oxidation rates over a wide range of exercise intensities”. International Journal of Sports Medicine 25.1(2004): 32-37.
- A Pérez-Martin., et al. “Balance of substrate oxidation during submaximal exercise in lean and obese people”. Diabetes Metabolism 27.4 Pt 1(2001): 466-474.
- SJ Hunter and WT Garvey. “Insulin action and insulin resistance: diseases involving defects in insulin receptors, signal transduction, and the glucose transport effector system”. The American Journal of Medicine 105.4 (1998): 331-345.
- GM Reaven. “Banting lecture 1988. Role of insulin resistance in human disease”. Diabetes 37.12 (1988): 1595-1607.
- MF White and CR Kahn. “The insulin signaling system”. Journal of Biological Chemistry 269.1(1994): 1-4.
- B Cheatham and C R Kahn. “Insulin action and the insulin signaling network”. Endocrine Reviews 16.2(1995):117-142.
- CARVALHEIRA JB., et al. “Vias de sinalização da insulina. Arq, Bras”. Endocrinology and Metabolism 46.4 (2002): 419-425.
- MP Czech and S Corvera. “Signaling mechanisms that regulate glucose transport”. Journal of Biological Chemistry 274.4 (1999): 1865-1868.
- Peter R Shepherd and Barbara B Kahn. “Glucose Transporters and Insulin Action -- Implications for Insulin Resistance and Diabetes Mellitus”. The New England Journal of Medicine 341.4(1999): 248-257.
- T Ploug., et al. “Increased muscle glucose uptake during contractions: no need for insulin”. American Journal of Physiology 247.6 Pt 1(1984): E726- E731.
- Douen AG., et al. “Exercise induces recruitment of the "insulin-responsive glucose transporter". Evidence for distinct intracellular insulin- and exercise-recruitable transporter pools in skeletal muscle”. Journal of Biological Chemistry 265.23(1990): 13427-1330.
- JW Kennedy., et al. “Acute exercise induces GLUT4 translocation in skeletal muscle of normal human subjects and subjects with type 2 diabetes”. Diabetes 48.5 (1999): 1192-1197.
- Jeffrey E Pessin and Alan R Saltiel. “Signaling pathways in insulin action: molecular targets of insulin resistance”. Journal of Clinical Investigation 106.2(2000): 165-169.
- Hegarty BD., et al. “The role of intramuscular lipid in insulin resistance”. Acta Physiologica 178.4 (2003) 373-383.
- J Denis McGarry. “Banting lecture 2001: dysregulation of fatty acid metabolism in the etiology of type 2 diabetes”. Diabetes 51.1(2002): 7-18.
- M Krssak., et al. “Intramyocellular lipid concentrations are correlated with insulin sensitivity in humans: a 1H NMR spectroscopy study”. Diabetologia 42.1(1999)113-116.
- G Perseghin., et al. “Intramyocellular triglyceride content is a determinant of in vivo insulin resistance in humans: a 1H-13C nuclear magnetic resonance spectroscopy assessment in offspring of type 2 diabetic parents”. Diabetes 48.8 (1999):1600-1606.
- A Virkamäki., et al. “Intramyocellular lipid is associated with resistance to in vivo insulin actions on glucose uptake, antilipolysis, and early insulin signaling pathways in human skeletal muscle”. Diabetes 50.10(2001): 2337-2343.
- GI Shulman. “Cellular mechanisms of insulin resistance”. Journal of Clinical Investigation 106.2 (2000)171-176.
- M Roden., et al. “Mechanism of free fatty acid-induced insulin resistance in humans”. Journal of Clinical Investigation 97.12 (1996): 2859-2865.
- Dresner A., et al. “Effects of free fatty acids on glucose transport and IRS-1-associated phosphatidylinositol 3-kinase activity”. Journal of Clinical Investigation 103.2 (1999): 253-259.
- Juul Achten., et al. “Fat oxidation rates are higher during running compared with cycling over a wide range of intensities”. Metabolism 52.6(2003): 747-752.
- AMERICAN_DIABETES_ASSOCIATION. “Diagnosis and classification of diabetes mellitus”. Diabetes Care 27.1(2004): S5-S10.
- GA Brooks and J Mercier. “Balance of carbohydrate and lipid utilization during exercise: the "crossover" concept”. Journal of Applied Physiology 76.6 (1994) 2253-2261.
- W T Cefalu. “Insulin resistance: cellular and clinical concepts”. Experimental Biology and Medicine 226.1(2001): 13-26.
- SR Colberg., et al. “Utilization of glycogen but not plasma glucose is reduced in individuals with NIDDM during mild-intensity exercise”. Journal of Applied Physiology 81.5 (1996): 2027-2033.
- FRAYN, K. N. Regulation of fatty acid delivery in vivo. In: E. A. Richter, B. Kiens, H. Galbo e B. Saltin (Ed.). Skeletal muscle metabolism in exercise and diabetes. New York: Plenum Press, 1998.
- L J Goodyear., et al. “Effects of contractile activity on tyrosine phosphoproteins and PI 3-kinase activity in rat skeletal muscle”. American Journal of Physiology 268.5 Pt 1 (1995): E987-E995.
- GORDON, C. C., CHUMLEA, W. C. e ROCHE, A. F. Stature, recumbent length, and weight. In: T. G. Lohman, A. F. Roche e R. Martorell (Ed.). Anthropometric standardization reference manual. Champaign: Human Kinetics, 1988.
- GROSS JL and NEHME M. “Detecção e tratamento das complicações crônicas do diabetes melito: consenso da sociedade brasileira de diabetes e conselho brasileiro de oftalmologia”. Revista da Associação Médica Brasileira 45.3 (1999): 279-284.
- GROSS JL., et al. “Diabetes melito: diagnóstico, classificação e avaliação do controle glicêmico. Arq, Bras”. Endocrinology and Metabolism 46: (2002):16-26.
- Hargreaves, M. Skeletal muscle carbohydrate metabolism during exercise. In: M. Hargreaves (Ed.). Exercise metabolism. Champaign: Human Kinetics, 1995.
- HARRISON, G. H., BUSKIRK, E. R., CARTER, J. E. L., JOHNSTON, F. E., LOHMAN, T. G., POLLOCK, M. L., ROCHE, A. F. e WILMORE, J. Skinfold thicknesses and measurement technique. In: T. G. Lohman, A. F. Roche e R. Martorell (Ed.). Anthropometric standardization reference manual. Champaign: Human Kinetics, 1988.
- Holm C., et al. “Molecular mechanisms regulating hormone-sensitive lipase and lipolysis”. Annual Review of Nutrition 20(2000): 365-393.
- JF Horowitz and S Klein. “Lipid metabolism during endurance exercise”. The American Journal of Clinical Nutrition 72.2 Suppl (2000) 558S-563S.
- ET Howley., et al. “Criteria for maximal oxygen uptake: review and commentary”. Medicine & Science in Sports & Exercise 27.9(1995):1292-1301.
- AS Jackson and ML Pollock. “Generalized equations for predicting body density of men”. British Journal of Nutrition 40.3(1978): 497-504.
- Niels Jessen and Laurie J Goodyear. “Contraction signaling to glucose transport in skeletal muscle Journal of Applied Physiology 99.1(2005): 330-337.
- Asker E Jeukendrup. “Regulation of fat metabolism in skeletal muscle”. Annals of the New York Academy of Sciences 967(2002): 217-235.
- AE Jeukendrup., et al. “Fat metabolism during exercise: a review. Part I: fatty acid mobilization and muscle metabolism”. International Journal of Sports Medicine 19.4(1998): 231-244.
- LIMA, F. B., VESTRI, H. S., VESTRI, S. e MORAES, S. M. F. D. Lipólise. In: R. Curi, C. Pompéia, C. K. Miyasaka e J. Procopio (Ed.). Entendendo a gordura. Os ácidos graxos. Barueri: Manole, 2002.
- DA Malerbi and LJ Franco. “Multicenter study of the prevalence of diabetes mellitus and impaired glucose tolerance in the urban Brazilian population aged 30-69 yr. The Brazilian Cooperative Group on the Study of Diabetes Prevalence”. Diabetes Care 15.11(1992): 1509-1516.
- MAUGHAN, R., GLEESON, M. e GREENHAFF, P. L. Bioquímica do exercício e do treinamento. São Paulo: Manole. 2000.
- Melo FS., et al. “Especial condutas: diabetes mellitus”. Revista da Associação Médica Brasileira 60.7 (2003): 505-515.
- F Péronnet and D Massicotte. “Table of nonprotein respiratory quotient: an update”. Canadian journal of sport sciences 16.1(1991): 23-29.
- POWERS, S. K. e HOWLEY, E. T. Fisiologia do exercício: Teoria e aplicação ao condicionamento e ao desempenho. Barueri: Manole. 2000.
- SIRI, W. E. Body composition from fluid space and density. In: J. Brozek e A. Hanschel (Ed.). Techniques for meansuring body composition. Washington: National Academy of Science, 1961.
- SOCIEDADE_BRASILEIRA_DE_DIABETES. Consenso brasileiro obre diabetes 2002: Diagnóstico e medicação do diabetes melito e tratamento do diabetes melito tipo 2. Rio de Janeiro: Diagraphic. 2003.
- Lawrence L Spriet. “Regulation of skeletal muscle fat oxidation during exercise in humans”. Medicine & Science in Sports & Exercise 34.9(2002)1477-1484.
- WC Stanley and RJ Connett. “Regulation of muscle carbohydrate metabolism during exercise”. The FASEB Journal 5.8(1991): 2155-2159.
- Marek Straczkowski., et al. “Insulin resistance in the first-degree relatives of persons with type 2 diabetes”. Medical Science Monitor 9.5(2003): CR186-CR190.
- US_DEPARTMENT_OF_HEALTH_AND_HUMAN_SERVICES. Physical Activity and Health: A Report of the Surgeon General. US Dept of Health and Human Services, Centers for Disease Control and Prevention, National Center for Chronic Disease Prevention and Health Promotion. 1996.
- Tara M Wallace., et al. “Use and abuse of HOMA modeling”. Diabetes Care 27.6 (2004):1487-1495.
- Sarah Wild., et al. “Global prevalence of diabetes: estimates for the year 2000 and projections for 2030”. Diabetes Care 27.5 (2004): 1047-1053.
- WILMORE, J. H. e COSTILL, D. L. Fisiologia do esporte e do exercício. São Paulo: Manole. 2001.
- ZORZANO A., et al. “Mechanisms regulating GLUT4 glucose transporter expression and glucose transport in skeletal muscle”. Acta Physiologica 183.1(2005): 43-58.
Citation: Fabiano De Macedo Salgueirosa and Maria Gisele Dos Santo. “Diabetes: Insulin Resistance”. Medical Research and Clinical Case Reports 4.1 (2020): 18-24.
Copyright: © 2020 Fabiano De Macedo Salgueirosa and Maria Gisele Dos Santo. This is an open-access article distributed under the terms of the Creative Commons Attribution License, which permits unrestricted use, distribution, and reproduction in any medium, provided the original author and source are credited.






 Scientia Ricerca is licensed and content of this site is available under a Creative Commons Attribution 4.0 International License.