Research Article
Volume 2 Issue 4 - 2018
Polyphasic Approach to Bioremediation Monitoring of Crude Oil Impacted-Site in Ikarama Community, Bayelsa State Using Metabolic Fingerprinting and Illumina Miseq
1Department of Microbiology, Faculty of Science, University of Port Harcourt, P. M. B. 5323, Rivers State
2Department of Microbiology, Faculty of Science, University of Port Harcourt, P. M. B. 5323, Rivers State
3Department of Microbiology, Faculty of Science, University of Port Harcourt, P. M. B. 5323, Rivers State
2Department of Microbiology, Faculty of Science, University of Port Harcourt, P. M. B. 5323, Rivers State
3Department of Microbiology, Faculty of Science, University of Port Harcourt, P. M. B. 5323, Rivers State
*Corresponding Author: Charles Chibueze Ezekoye, Department of Microbiology, Faculty of Science, University of Port Harcourt, P. M. B. 5323, Rivers State.
Received: June 22, 2018; Published: July 19, 2018
Abstract
Microbial community composition and diversity during remediation by enhanced natural attenuation of oil-polluted site were monitored in a 60-day bioremediation study to understand the interrelationships among microbial community composition, pollution level and the metabolic activities of hydrocarbon utilizing bacteria (HUB). Soil samples were collected from polluted soil pre-remediation, during remediation (DR) and post-remediation (AR) while unpolluted soil taken 70–80 km away served as control. Microbial analyses were done using Analytical Profile Index (API) and Illumina Miseq. HUB present in clean soil, polluted soil, soil during and after remediation using API included Gammaproteobacteria, Alphaproteobacteria and Bacilli; Gammaproteobacteria, Betaproteobacteria and Bacilli; Gammaproteobacteria, Betaproteobacteria and Bacilli; Gammaproteobacteria, Betaproteobacteria and Bacilli, respectively. HUB proliferated more during remediation (DR) than in control, polluted soil and after remediation soil. This corresponded with Illumina MiSeq data which revealed that there was high bacterial population present in soil during remediation (98.9%) and control (98.75%) whereas the bacterial populations in the polluted soil pre-remediation (75.01%) and after remediation (96.44%) were low. By day 60, total petroleum hydrocarbons (TPH) and polyaromatic hydrocarbons (PAHs) decreased progressively from 16,618 ± 212mg/kg to 280 ± 11.9mg/kg and 154.14 ± 9.8mg/kg to 26.0±1.06mg/kg, respectively. Remediation by natural attenuation increased HUB population during treatment while their metabolic activities enhanced hydrocarbon biodegradation. Proteobacteria was the key bacterial populations that were involved in the bacterial hydrocarbon degradation and were reliably identified using Illumina Miseq and API.
Key Words: Illumina Miseq; API; Crude oil-impacted site; Bioremediation
Introduction
The Niger Delta (Nigeria) is a region for intensive and extensive oil exploration and production activities, the main sources of foreign exchange to the Nigerian economy (Owugah, 2001). Unfortunately, these activities have led to several oil spillage incidents causing mass deforestation and subsequently degradation of the environments (Ezekoye., et al. 2017). This has become a major problem that faced the people of Niger Delta as a result of the pollution of ecosystems (land and water bodies).
Efforts towards reclaiming the degraded environments has resulted to several techniques like RENA (now refer to as Land farming) which involves many techniques including Land farming by biostimulation or bioaugmentation of soil biota with commercially available micro flora (Ebuhie., et al. 2005; Ezekoye., et al. 20017). Biostimulation is the process of providing the microbial communities with the rate – limiting resources like nitrogen, phosphorus (addition of organic or inorganic fertilizer) and oxygen (usually by tilling to aerate the soil) to speed up the bioremediation process (Kaplan., et al. 2004; Roling., et al 2002). Land farming is a well – practiced techniques used in the Niger Delta to bioremediate crude oil contamination in soils to reduce the oil concentration and the associated risks to human health and the environment (Maila and Cloete, 2004). In this technique, the indigenous microbiota principally mediates the biodegradation of the petroleum hydrocarbon constituents, although volatilization, abiotic processes and fungal-mediated processes may also play a part (Maila Cloete, 2004). Great success has been recorded with the use of this technique and the contributions of microbial indices in bioremediation projects. The United Nations Environmental Programme (UNEP) report on the impact of oil spill in Ogoniland lacked conclusive microbial indices to evaluate site amenability to bioremediation. Therefore, there is a need to develop a frame work for monitoring bioremediation progress using high throughput microbial detection technology since biostimulation (remediation by enhanced natural attenuation) of extant indigenous hydrocarbon degrading bacteria is the remedial technology used by major oil industries in Nigeria.
Studies involved in soil microbial community composition could not only help us to explore the potential risks associated with polluted soils but provide an insight into possible soil remediation strategies using indigenous resistant bacteria. It is well known that some rhizosphere microorganisms can be used for phytoremediation (Navarro-Nova., et al. 2010; Lundberg., et al. 2012; Feng., et al. 2018) However, microbes can rapidly respond to anthropogenic pressures, making it possible to be an indicator of soil quality and health (Kaschuk., et al. 2010; Preston-Mafham., et al. 2002; Feng., et al. 2018). Furthermore, studies has been shown to change the taxanomic diversity and function of the native microbial species (Li and Wen, 2004; de Campos., et al. 2013; Hill., et al. 2000). Also Hong and Si revealed that varying concentrations of heavy metals surrounding an iron mining areas increased bacterial alpha diversity and resulted in a shift of the dominant genera (Hong., et al. 2015 and Feng., et al. 2018). However, many studies have shown that only small portion (0.1 to 1%) of the microorganisms are culturable in the soil samples (Amann., et al. 1995; Giovannoni., et al. 1990; Hugenholtz., et al. 1998; Torsvic., et al. 1990 and Feng., et al. 2018), hence the need for culture independent metagenomic methods for analysis of soil microbial community (Jones., et al. 2012; Mason., et al. 2012 and Feng., et al. 2018) and improve our knowledge of the soil microbes and its potential significance. Also studies have not been done using high throughput metagenomic technology (Illumina Miseq) to monitor bioremediation of crude oil polluted soil in Nigeria. Most available reports were beyond the shores of this country (Nigeria). Therefore, in this study, we assessed the microbial community structure of crude oil- polluted soil that was undergoing remediation by enhanced natural attenuation using metabolic fingerprinting and Illumina Miseq.
Materials and Methods
Site description
The study area was a polluted site that was undergoing Land farming treatments in Ikarama community, Bayelsa State. Co-ordinates of the sampling points were determined using Global Positioning System (GPS). The coordinates of the site A are: North (05° 081 07.3) and East (006° 281 07.5)
The study area was a polluted site that was undergoing Land farming treatments in Ikarama community, Bayelsa State. Co-ordinates of the sampling points were determined using Global Positioning System (GPS). The coordinates of the site A are: North (05° 081 07.3) and East (006° 281 07.5)
Sample collection
The hydrocarbon polluted soil were collected with 0-15 cm soil auger (Chikere and Ekwuabu, 2014) from three different hydrocarbon polluted sites into plastic pail cleaned with cotton wool soaked in 70% alcohol at each phase of the study (Eziuzor and Okpokwasili, 2009). The soil were collected from four sampling points and mixed together after excavation.
The hydrocarbon polluted soil were collected with 0-15 cm soil auger (Chikere and Ekwuabu, 2014) from three different hydrocarbon polluted sites into plastic pail cleaned with cotton wool soaked in 70% alcohol at each phase of the study (Eziuzor and Okpokwasili, 2009). The soil were collected from four sampling points and mixed together after excavation.
The excavated soil was transported to Pharmacology laboratory and Environmental microbiology laboratory of Niger Delta University and University of Port Harcourt for microbiology/physicochemical and molecular analysis, respectively while the amplicons were sent to Inquaba for 16S RNA Illumina Miseq.
Bioremediation study
Ikarama site, Bayelsa State
This was a sixty (60) days bioremediation of the polluted sites using Land farming treatment techniques. The control used from this study was taken from a farm land which is located about 70m-80m away from the polluted site. Prior to the remediation proper, the sites were cleared and the vegetation impacted debris was burnt and Baseline study was carried out. The tractor was employed to till the polluted soil to expose it to bacteria activity in order to breakdown the carbon chain. There was possibility of bulking (2m deep which is below pipe line right of way) and amendment of the polluted soil, after which windrows were created and left for four to eight days with consecutive turning of the ridges/windrow and breaking of the lump soil. Also After eight days, the soil was levelled and there was obvious clearance of the crude oil (pollutant). Few days after the remediation there was heavy down pour in Bayelsa State which encourages growth of grasses as evidence of Eco restoration.
Physico-chemical analyses
The parameter studied were the soil pH, conductivity, total organic carbon (%), total nitrogen (%), total petroleum hydrocarbon (TPH), polyaromatic hydrocarbon (PAH), total hydrocarbon content (THC).
The parameter studied were the soil pH, conductivity, total organic carbon (%), total nitrogen (%), total petroleum hydrocarbon (TPH), polyaromatic hydrocarbon (PAH), total hydrocarbon content (THC).
Microbiological analysis
Enumeration of total culturable heterotrophic bacteria (TCHB)
The spread plate method on plate count agar (Anatech Laboratories Ltd) was used in the enumeration of heterotrophic bacteria.
Enumeration of total culturable heterotrophic bacteria (TCHB)
The spread plate method on plate count agar (Anatech Laboratories Ltd) was used in the enumeration of heterotrophic bacteria.
Enumeration of total culturable hydrocarbon utilizing bacteria (TCHUB)
The enumeration of total culturable hydrocarbon utilizing bacteria, HUB was done on Bushnell Hass agar using the vapour phase method reported by Hamamura et al. (2006).
The enumeration of total culturable hydrocarbon utilizing bacteria, HUB was done on Bushnell Hass agar using the vapour phase method reported by Hamamura et al. (2006).
Isolation, Characterization and Identification of Hydrocarbon utilizing Bacteria
After enumeration, representative colonies of the different morphological types that appeared on the plates after incubation was carefully picked with a sterile inoculating needle and sub-cultured to purify them. This was done by streaking aseptically, onto freshly prepared nutrient agar plates. After incubation the purity of the isolates was checked by subjecting them to the Gram staining technique and analytical profile index (API) was used in identification.
After enumeration, representative colonies of the different morphological types that appeared on the plates after incubation was carefully picked with a sterile inoculating needle and sub-cultured to purify them. This was done by streaking aseptically, onto freshly prepared nutrient agar plates. After incubation the purity of the isolates was checked by subjecting them to the Gram staining technique and analytical profile index (API) was used in identification.
Gram staining and Biochemical characteristics of hydrocarbon utilizing bacterial (HUB) isolates
Bacterial isolates growing on Bushnel Hass agar (BHA) were sub-cultured into a nutrient agar plate. Pure cultures were Gram stained and subjected to different biochemical tests using the standard Analyical Profile Index (API) 20 kits at the Department of Biotechnology, Federal Institute of Industrial Research, Oshodi. The API has species specificity as Polymerase Chain reaction. There are API kits for Bacillus and yeasts. Organisms identified to be Bacillus through the conventional biochemical characterization were identified to species level using API kits.
Bacterial isolates growing on Bushnel Hass agar (BHA) were sub-cultured into a nutrient agar plate. Pure cultures were Gram stained and subjected to different biochemical tests using the standard Analyical Profile Index (API) 20 kits at the Department of Biotechnology, Federal Institute of Industrial Research, Oshodi. The API has species specificity as Polymerase Chain reaction. There are API kits for Bacillus and yeasts. Organisms identified to be Bacillus through the conventional biochemical characterization were identified to species level using API kits.
Identification of hydrocarbon utilizing bacteria
Petroleum hydrocarbon utilizing bacterial species were identified using both API and Next generation Sequencing (Illumina Miseq platform) by Inqaba, Pretoria, South Africa. Meanwhile the Polymerase Chain Reaction (PCR) with appropriate primers was done at the Niger Delta University Bedford, Bayelsa State.
Petroleum hydrocarbon utilizing bacterial species were identified using both API and Next generation Sequencing (Illumina Miseq platform) by Inqaba, Pretoria, South Africa. Meanwhile the Polymerase Chain Reaction (PCR) with appropriate primers was done at the Niger Delta University Bedford, Bayelsa State.
Molecular Identification
DNA Extraction, PCR and Sequencing
Extraction was done according to manufacturer’s instruction using a ZR bacterial DNA mini prep extraction kit supplied by Inqaba South Africa. Their concentration and purity were measured spectrometrically with Nano Drop ND1000.
DNA Extraction, PCR and Sequencing
Extraction was done according to manufacturer’s instruction using a ZR bacterial DNA mini prep extraction kit supplied by Inqaba South Africa. Their concentration and purity were measured spectrometrically with Nano Drop ND1000.
The bacterial V1 – V3 variable regions of 16S rRNA genes were then amplified using the 27F: 5’ TCGTCGGCAGCGTCAGATGTGTATAAGAGACAGGAGTTTGATCCTGGCTCAG and 518R:5’ GTCTCGTGGGCTCGGAGATGTGTATAAGAGACAGATTACCGCGGCTGCTGG primers with adapters on a ABI 9700 Applied Bio systems thermal cycler at a final volume of 50 micro litres for 35 cycles. The PCR mix included: the X2 Dream taq Master mix supplied by Inqaba, South Africa (taq polymerase, DNTPs, MgCl), the primers at a concentration of 0.4M and the extracted DNA as template. The PCR conditions were as follows: Initial denaturation, 95ºC for 5 minutes; denaturation, 95ºC for 30 seconds; anealing, 52ºC for 30 seconds; extension, 72ºC for 30 seconds for 35 cycles and final extension, 72ºC for 5 minutes. The product was resolved on a 1% agarose gel at 120V for 15 minutes and visualized on a UV transilluminator.
Sequencing
Sequencing was done on an Illumina Miseq platform by Inqaba, Pretoria, South Africa.
Sequencing was done on an Illumina Miseq platform by Inqaba, Pretoria, South Africa.
Sequence Data Process OTU Cluster and Taxonomic Assignment
Raw fast files were DE multiplexed and quality screened with QIIME Pipeline (Version 1.9.0). After being trimmed and assigned to each sample based on sample codes, sequences with high quality (length > 200 bp, without ambiguous base ‘N’, and average base quality score > 30) were chimera checked with UCHIME2 using Silva gold alignment as a reference dataset. Sequences were clustered into operational taxonomic units (OTUs) at a 97% identity threshold by using the Uclust algorithm. The samples were rarefied to even number of 272 sequences using random screening. The remaining OTUs were identified and assigned to different taxas using GREENGENES database (May, 2013 release) reference taxonomy. The biom OTU table generated in QIIME was converted to a MOTHUR shared file and used to generate Venn diagrams of shared OTUs and calculation of UPGMA tree parsimony of the various samples in MOTHUR software (v.1.39.0) (Schloss et al. 2009).
Raw fast files were DE multiplexed and quality screened with QIIME Pipeline (Version 1.9.0). After being trimmed and assigned to each sample based on sample codes, sequences with high quality (length > 200 bp, without ambiguous base ‘N’, and average base quality score > 30) were chimera checked with UCHIME2 using Silva gold alignment as a reference dataset. Sequences were clustered into operational taxonomic units (OTUs) at a 97% identity threshold by using the Uclust algorithm. The samples were rarefied to even number of 272 sequences using random screening. The remaining OTUs were identified and assigned to different taxas using GREENGENES database (May, 2013 release) reference taxonomy. The biom OTU table generated in QIIME was converted to a MOTHUR shared file and used to generate Venn diagrams of shared OTUs and calculation of UPGMA tree parsimony of the various samples in MOTHUR software (v.1.39.0) (Schloss et al. 2009).
OTU based analysis of Alpha diversity of the various samples
After quality screening to remove sequencing errors and chimeric sequences, the total number of sequences were 179,984. The samples were rarefied to even number of 272 to accommodate all the samples. The total number of OTUs were 5550 while the total number of counts were 41,914. The summary of microbial counts per sample prior to rarefying is showm below
A: 362.0; AR: 3216.0; DR: 8003.0; B: 30333.0
Phylogenetic Analyses
The sequences of the representative OTUs obtained in this study were compared to those in GREENGENES data base. The closest sequences and selected reference sequences were downloaded and aligned using QIIME.
The sequences of the representative OTUs obtained in this study were compared to those in GREENGENES data base. The closest sequences and selected reference sequences were downloaded and aligned using QIIME.
UPGMA tree was also constructed using QIIME and visualize using phyloseq R package. The evolutionary distances were computed using the Jukes-Cantor method with the trees bootstrapped 1000 times.
Statistical Analyses
Statistical analyses were carried out using Statistical package for social sciences (SPSS, Version 17.0). Analysis of variance (ANOVA) was carried out at 95% level of confidence using statistical package for social sciences
Statistical analyses were carried out using Statistical package for social sciences (SPSS, Version 17.0). Analysis of variance (ANOVA) was carried out at 95% level of confidence using statistical package for social sciences
Biodiversity Analysis
Alpha and Beta diversity analysis were done using QIIME and MOTHUR. Total richness and shared OTUs between sample replicates as well as samples were revealed by constructing Venn diagrams from the shared file generated in MOTHUR. UPGMA-dendrogram was visualized using FIGTREE. Newick formatted phylogenetic tree, richness and abundance data visualization and Non metric multidimensional scaling (NMDS) of data was done with the R program using Vegan, Phyloseq and Biodiversity R packages (Kindt and Coe, 2005; McMurdie and Holmes, 2013; Oksanen., et al. 2016).
Alpha and Beta diversity analysis were done using QIIME and MOTHUR. Total richness and shared OTUs between sample replicates as well as samples were revealed by constructing Venn diagrams from the shared file generated in MOTHUR. UPGMA-dendrogram was visualized using FIGTREE. Newick formatted phylogenetic tree, richness and abundance data visualization and Non metric multidimensional scaling (NMDS) of data was done with the R program using Vegan, Phyloseq and Biodiversity R packages (Kindt and Coe, 2005; McMurdie and Holmes, 2013; Oksanen., et al. 2016).
Nucleotide Sequence Accession Numbers
Paired end Illumina sequence data from this study were deposited in Gen Bank under Bio Project ID PRJNA432037
Paired end Illumina sequence data from this study were deposited in Gen Bank under Bio Project ID PRJNA432037
Results and Discussion
Site description and Physicochemical Characteristics
The study area was a polluted site that was undergoing Land farming treatments in Ikarama community, Bayelsa State. The physicochemical parameters studied include pH, conductivity, total organic carbon, total nitrogen, total petroleum hydrocaborn (TPH), polyaromatic hydrocarbon (PAHs), and total hydrocarbon content. The pH, conductivity, total organic carbon, total nitrogen and total hydrocarbon content values of the polluted soil and control were 7.06 ± 0.2 and 5.89 ± 0.07, 48.9 ± 2.13 and 5.48 ± 0.04, 1.2 ± 0.01 and 0.08 ± 0.00, 0.45 ± 0.02 and 0.33 ± 0.01, 16772 ± 199 and 281 ± 15.4, respectively (Table 1). The total petroleum hydrocarbon, Polyaromatic hydrocarbon and bacterial count were used to monitoring the polluted soil during the study period. The values of total petroleum hydrocarbon, Polyaromatic hydrocarbon, total heterotrophic bacterial count and hydrocarbon utilizing bacterial count in the pre-remediation/control and during remediation/post remediation are shown in (Table 1 and 2) respectively. This indicates that hydrocarbon utilizing bacterial populations in the pre-remediation were relatively adequate for bioremediation (Figure 2). This observation was in accordance with Ebuehi., et al. 2005. Also in (Table 1), there was decrease in total heterotrophic and total hydrocarbon utilizing bacterial populations in pre-remediation soil and progressive increase during remediation when compared with unpolluted soil (control). These might be as a result of effect of crude oil on the bacterial populations and enhancement during remediation, respectively (Figure 2).
The study area was a polluted site that was undergoing Land farming treatments in Ikarama community, Bayelsa State. The physicochemical parameters studied include pH, conductivity, total organic carbon, total nitrogen, total petroleum hydrocaborn (TPH), polyaromatic hydrocarbon (PAHs), and total hydrocarbon content. The pH, conductivity, total organic carbon, total nitrogen and total hydrocarbon content values of the polluted soil and control were 7.06 ± 0.2 and 5.89 ± 0.07, 48.9 ± 2.13 and 5.48 ± 0.04, 1.2 ± 0.01 and 0.08 ± 0.00, 0.45 ± 0.02 and 0.33 ± 0.01, 16772 ± 199 and 281 ± 15.4, respectively (Table 1). The total petroleum hydrocarbon, Polyaromatic hydrocarbon and bacterial count were used to monitoring the polluted soil during the study period. The values of total petroleum hydrocarbon, Polyaromatic hydrocarbon, total heterotrophic bacterial count and hydrocarbon utilizing bacterial count in the pre-remediation/control and during remediation/post remediation are shown in (Table 1 and 2) respectively. This indicates that hydrocarbon utilizing bacterial populations in the pre-remediation were relatively adequate for bioremediation (Figure 2). This observation was in accordance with Ebuehi., et al. 2005. Also in (Table 1), there was decrease in total heterotrophic and total hydrocarbon utilizing bacterial populations in pre-remediation soil and progressive increase during remediation when compared with unpolluted soil (control). These might be as a result of effect of crude oil on the bacterial populations and enhancement during remediation, respectively (Figure 2).
| Parameter | Method | Polluted soil (PS) | Control (Ctrl) |
| pH | APHA 4500-H | 7.06 ± 0.2 | 5.89 ± 0.07 |
| Conductivity (µS/cm) | APHA 2510-B | 48.9 ± 2.13 | 5.48 ± 0.04 |
| Total Organic Carbon (%) | Spectrometry | 1.2 ± 0.01 | 0.08 ± 0.00 |
| Total nitrogen (%) | APHA 4500 | 0.45 ± 0.02 | 0.33 ± 0.01 |
| TPH (mg/kg) | USEPA 8015 | 16618 ± 212 | 277.3 ± 18 |
| PAH (mg/kg) | USEPA 8270 | 154.14 ± 9.8 | 7.3 ± 0.11 |
| THC (mg/kg) | ASTM D3921 | 16772 ± 199 | 281 ± 15.4 |
| TCHBC (Cfu/g) | Plate count | 6.85 x10⁴ ± 0.03 | 8.35 x 10⁴ ± 0.09 |
| THUBC (Cfu/g) | Plate count | 1.33 x10⁵ ± 0.02 | 1.91 x10⁴ ± 0.08 |
Table 1: Baseline Physicochemical and Microbiological Parameters in Ikarama Community.
Legend: THBC = total heterotrophic bacterial count; THUBC = total hydrocarbon utilizing bacterial count; TPH = total petroleum hydrocarbon; PAH = polycyclic aromatic hydrocarbon; TOC = total organic carbon; PS = polluted soil; Ctrl = Control; USEPA =United States Environmental Protection Agency, APHA = American Public Health Association, ASTM = American Society for Testing and Materials
Legend: THBC = total heterotrophic bacterial count; THUBC = total hydrocarbon utilizing bacterial count; TPH = total petroleum hydrocarbon; PAH = polycyclic aromatic hydrocarbon; TOC = total organic carbon; PS = polluted soil; Ctrl = Control; USEPA =United States Environmental Protection Agency, APHA = American Public Health Association, ASTM = American Society for Testing and Materials
| Parameters | Method | During remediation | Post remediation (PS) |
| TPH (mg/kg) | USEPA 8015 | 665 ± 17.3 | 280 ± 11.9 |
| PAH (mg/kg) | USEPA 8270 | 149.88 ± 9.0 | 26 ± 1.06 |
| THBC (Cfu/ml) | Plate count | 1.70 x10⁵ ± 0.01 | 7.65 x10⁴ ± 0.04 |
| THUBC (Cfu/ml) | Plate count | 1.62 x10⁵ ± 0.07 | 5.85 x10⁴ ± 0.05 |
Table 2: Physicochemical and Microbiological Parameters in Ikarama Community during Bioremediation monitoring in Ikarama Community.
Legend: THBC = total heterotrophic bacterial count; THUBC = total hydrocarbon utilizing bacterial count; TPH = total petroleum hydrocarbon; PAH = polycyclic aromatic hydrocarbon; PS= post remediation, USEPA =United States Environmental Protection Agency
Legend: THBC = total heterotrophic bacterial count; THUBC = total hydrocarbon utilizing bacterial count; TPH = total petroleum hydrocarbon; PAH = polycyclic aromatic hydrocarbon; PS= post remediation, USEPA =United States Environmental Protection Agency
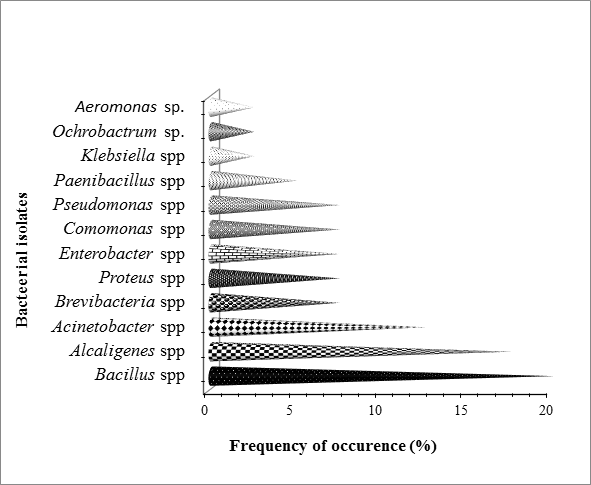
Figure 1: Percentage occurrence of the bacterial isolates
during bioremediation based on API analysis.
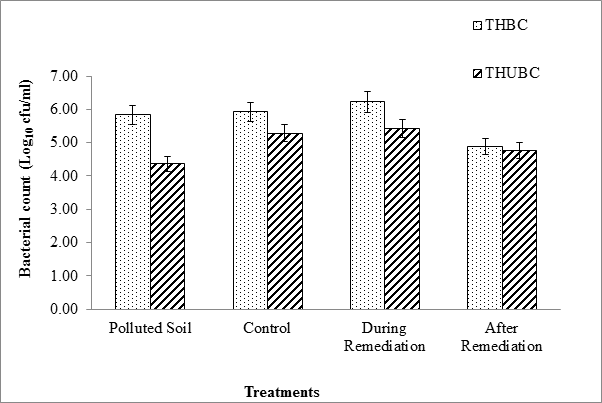
Figure 2: Logarithmic total heterotrophic bacterial (THBC) and total
hydrocarbon utilizing bacterial (THUBC) during the study period.
The response of indigenous hydrocarbon utilizing bacterial to Land farming treatments was generally successful with a high bacterial populations observed during remediation as time elapsed. The bacteria exhibited ability to degrade or utilize the different petroleum hydrocarbon components as sole source of carbon (Ezekoye., et al. 2017). Therefore, the percentage occurrence of hydrocarbon utilizing bacterial isolated from this study using Analytical profile index (API) include Bacillus spp. (20), Alcaligenes spp. (17.5), Acinetobacter spp. (12.5), Brevibacillus spp. (7.5), Proteus spp. (7.5), Enterobacter spp. (7.5), Comamonas spp. (7.5), Pseudomonas spp. (7.5), Paenibacillus spp. (5), Klebsiella sp. (2.5), Ochrobactrum sp. (2.5) and Aeromonas sp. (2.5) (Figure 1).
Bacterial Diversity and Cluster Analysis
We obtained a total of 179984 high quality bacterial sequences from the Illumina sequencing platform with an average read length of 272 bp from four samples. Using 97% identity cut-off, there were 5550 OTUs in the complete data set.
We obtained a total of 179984 high quality bacterial sequences from the Illumina sequencing platform with an average read length of 272 bp from four samples. Using 97% identity cut-off, there were 5550 OTUs in the complete data set.
The samples were rarefied to 272 sequences for alpha and beta diversity and bootstrapping analyses. The indices of bacterial diversity were estimated using a Rarefaction Curve (Figure 3). This indicated that the sequencing results had good coverage of the four samples. By rarefaction analysis estimates (Figure 3), the trend for species richness in different samples was found to be low to high: pre-remediation>post-remediation > during remediation > control. These might be as a result of effect of crude oil on pre-remediation soil and enhancement during remediation.
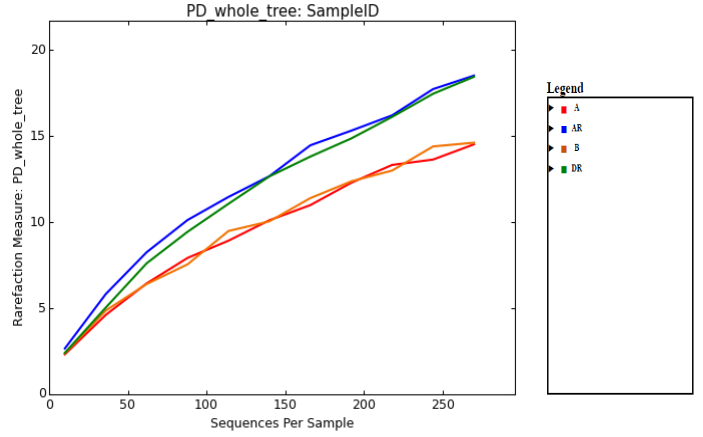
Figure 3: Observed taxonomic unit analysis (Rarefaction Curve) of even sampling depth.
Legend: A; pre-remediation, B: Control, DR; during remediation, AR; post remediation.
Legend: A; pre-remediation, B: Control, DR; during remediation, AR; post remediation.
Good coverage of 100% was obtained for all the samples representing almost whole range of bacterial diversity. The observed, Shannon and Invsimpson diversity measure all indicated that alpha diversity of bacterial community increases during remediation, post remediation and control than in pre-remediation (Figure 4) with a progressive loss of Total petroleum hydrocarbon. Moreover when compared with loss of Polyaromatic concentration (PAHs), the same trend was observed. Shannon index had high bacterial diversity observed during remediation while Post remediation and Control had the highest bacterial diversity and richness in Inversimpson and Observed index, respectively indicating that the highest bacterial diversity was present and richer in post-remediation and control (Figure 5). There was a statistical significant difference found between during remediation, post remediation, pre-remediation and control. The alpha diversity also affects the total petroleum hydrocarbon and polyaromatic hydrocarbon. There was an increase in alpha diversity of bacterial population during RENA which led to a progressive loss of TPH and PAH during bioremediation (figure 4 and 5).
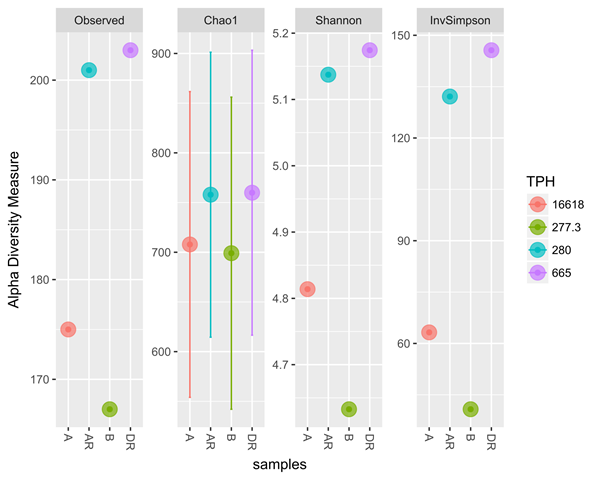
Figure 4: Alpha diversity of the samples using different diversity index (Observed, Shannon,
InvSimpson) to compare the effect of TPH concentration on diversity
Legend: A; pre-remediation, B: Control, DR; during remediation, AR; post remediation.
Legend: A; pre-remediation, B: Control, DR; during remediation, AR; post remediation.
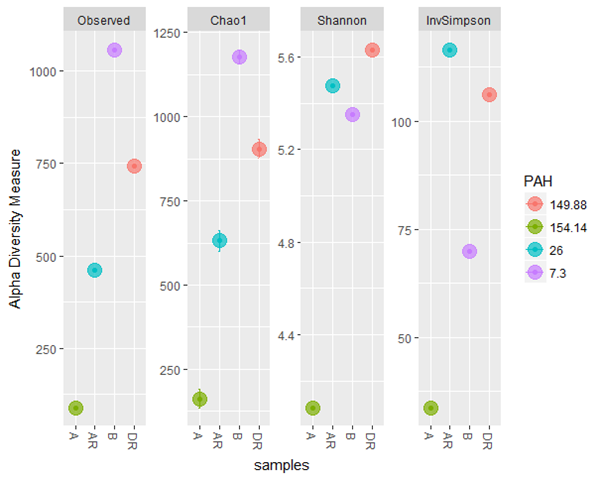
Figure 5: Alpha diversity of the samples using different diversity index (Observed, Shannon,
and InveSimpson) to determine the effect of PAHs concentration on diversity and richness
Legend: A; pre-remediation, B: Control, DR; during remediation, AR; post remediation.
Legend: A; pre-remediation, B: Control, DR; during remediation, AR; post remediation.
The metagenomics result also corresponded with culture-dependent result with a progressive increase in total heterotrophic bacterial and hydrocarbon utilizing bacteria during remediation (Figure 6 and 7). The four samples from metagenomic analyses were later grouped into two treatments namely; polluted and unpolluted samples during analyses. The pre-remediation soil and during remediation soil were grouped as polluted while the control and post-remediation soil were grouped as unpolluted samples. Bacterial diversity when compared in polluted and unpolluted treatments showed that there was a progressive increase of bacterial diversity in unpolluted samples than polluted samples (Figure 8). This might be attributed to the toxic impacts of the hydrocarbon in indigenous microbial flora.
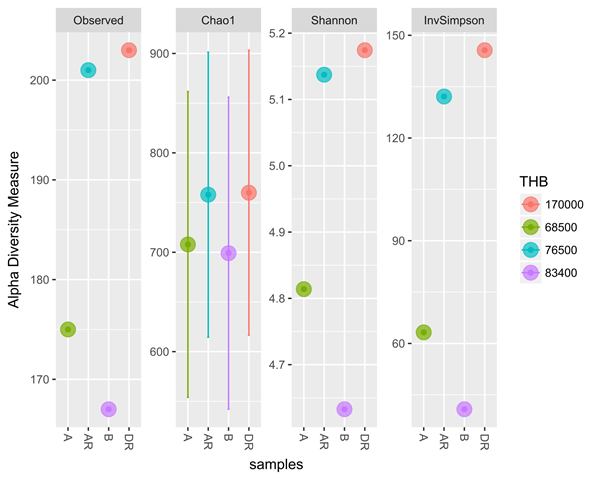
Figure 6: Diversity measure comparing metagenomics and culture – dependent
methods for Total heterotrophic bacteria (THB)
Legend: A; pre-remediation, B: Control, DR; during remediation, AR; post remediation
Legend: A; pre-remediation, B: Control, DR; during remediation, AR; post remediation
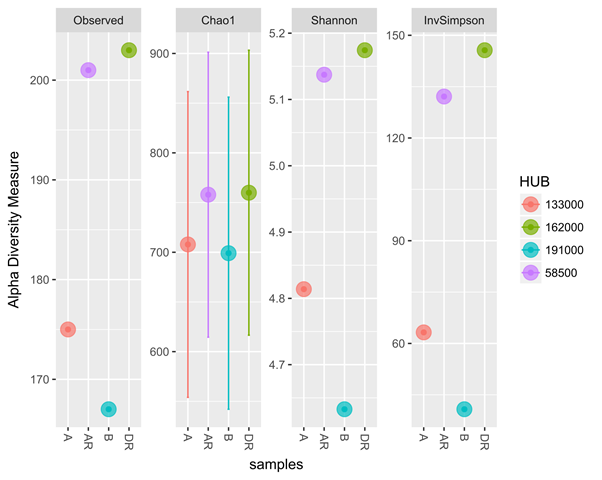
Figure 7: Diversity measure comparing hydrocarbon utilizing bacterial from metagenomic and culture – dependent methods
Legend: A; pre-remediation, B: Control, DR; during remediation, AR; post remediation
Legend: A; pre-remediation, B: Control, DR; during remediation, AR; post remediation
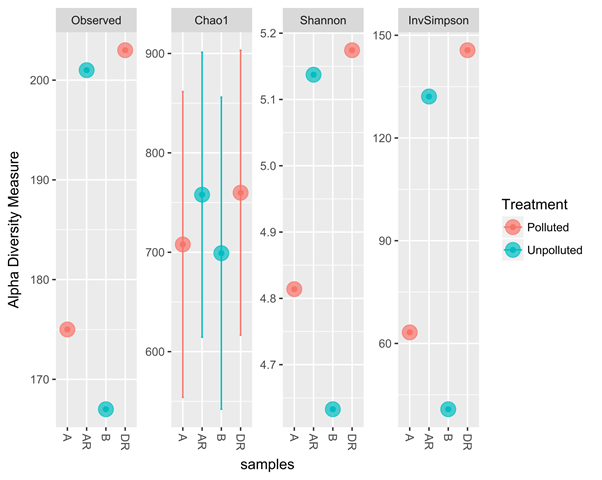
Figure 8: Treatments comparing the polluted and unpolluted samples
Legend: A; pre-remediation, B: Control, DR; during remediation, AR; post remediation
Legend: A; pre-remediation, B: Control, DR; during remediation, AR; post remediation
The non-multidimensional split (NMDS) plot scale showed the different phylum responsible for the spread of the samples. NMDS plot showed how the samples clustered to each other which indicate the closeness or similarity of the samples to each other. We also observed the closeness of post – remediation samples and control samples to each other (figure 9). This observation indicates that the remediation was successful and the pre-remediation soil (polluted soil) has returned to its original state.
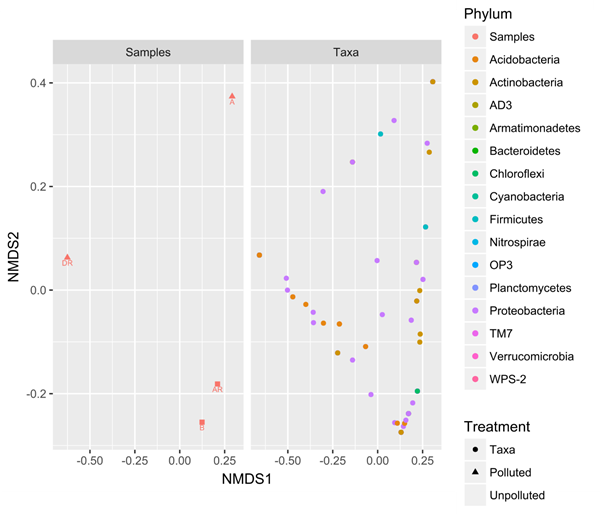
Figure 9: Non-metric multidimensional Scale plot comparing the samples during bioremediation
Legend: A; pre-remediation, B: Control, DR; during remediation, AR; post remediation
Legend: A; pre-remediation, B: Control, DR; during remediation, AR; post remediation
Bacterial Distribution and Abundance
(Figure 10) showed that there was a shift in bacterial communites as remediation progressed. Proteobacteria was the most abundant phylum in all the samples during the study period. Proteobacteria were predominant in all the samples especially during remediation. There was less bacterial diversity in pre-remediation while high bacterial diversity was observed during remediation. Interestingly, acid bacteria was the least predominant (low abundance) in pre-remediation soil but increased progressively during remediation and thereafter decreased slightly in post –remediation (figure 10). Also Firmicutes decreased in abundance during remediation and increased in post-remediation soil. This result showed that hydrocarbon pollution has high toxic impacts on acidobacteria while nutrient enhancement encourages their growth. Meanwhile the decrease in abundance of firmicutes during remediation might be attributed to the toxic effect of oxygen which was created during tilling of the soil which suggests that they are anaerobic bacteria. However, ADS, OP3, TM7, and WPS-2 are unclassified organisms that are novel.
(Figure 10) showed that there was a shift in bacterial communites as remediation progressed. Proteobacteria was the most abundant phylum in all the samples during the study period. Proteobacteria were predominant in all the samples especially during remediation. There was less bacterial diversity in pre-remediation while high bacterial diversity was observed during remediation. Interestingly, acid bacteria was the least predominant (low abundance) in pre-remediation soil but increased progressively during remediation and thereafter decreased slightly in post –remediation (figure 10). Also Firmicutes decreased in abundance during remediation and increased in post-remediation soil. This result showed that hydrocarbon pollution has high toxic impacts on acidobacteria while nutrient enhancement encourages their growth. Meanwhile the decrease in abundance of firmicutes during remediation might be attributed to the toxic effect of oxygen which was created during tilling of the soil which suggests that they are anaerobic bacteria. However, ADS, OP3, TM7, and WPS-2 are unclassified organisms that are novel.
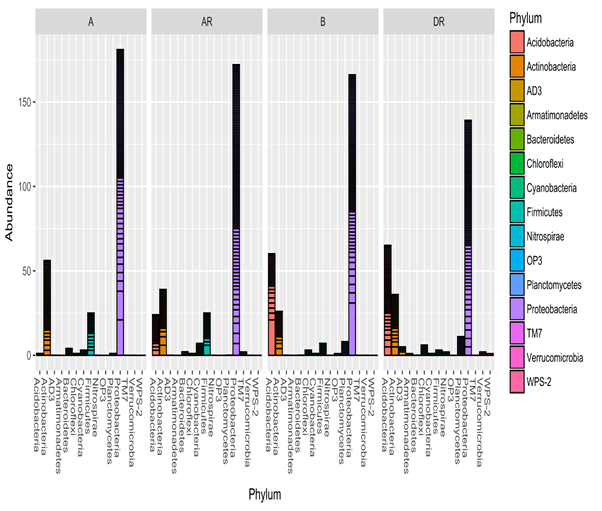
Figure 10: Relative abundance of bacterial phyla during bioremediation
Legend: A; pre-remediation, B: Control, DR; during remediation, AR; post remediation
Legend: A; pre-remediation, B: Control, DR; during remediation, AR; post remediation
The hierarchial heatmap at the bacterial family level showed the different community structure and abundance shift of 60 most abundant bacterial species, pre-, during and post remediation. There was a high abundance of bacterial diversity during and post remediation. The colours indicate relative abundance. Light and dark blue indicate high and low abundance level, respectively. Moreover, there was a shift in the bacterial community (actinobacteria, alpha proteobacteria and gamma proteobacteria were predominant in polluted soil pre-, during remediation and post remediation, respectively) during the study period. Similarly, Peng., et al. 2008 studied microbial degradation of Polyaromatic hydrocarbon. In their study they observed that aeration change stimulated by soil excavation would cause the change in microbial community composition. At early stage of biodegradation in their study, they observed Alphaproteobacteria group (genera Sphingomonas and Azospirillum) as the dominant group in all treatments. At later stages, the Gammaproteobacteria group (genus Xanthomonas), the Alphaproteobacteria group (genus Shingomonas) and the Cytophaga – Flexibacter – Bacteroides group (Bacteroidetes) were the dominant groups that did not receive nutrients while Gamma proteobacteria group (genus Xanthomonas), the Betaproteobacteria group (genera Alcaligenes and Achromobacter), and the alphaproteobacteria group ( Sphingomonas) were the dominant groups that received nutrients (Speng., et al. 2008, Vinas., et al. 2005).
The addition of nutrients to the contaminated site accelerated the growth of indigenous microorganisms and their increased biological activities had an effect on reducing the time for oil degradation. Many studies (both in-situ and laboratory based) have already been described to increase microbial activity and the rate of biodegradation following the addition of inorganic nutrients such as nitrogen and phosphorus (Magesin and Schineer, 2001; Rolling., et al. 2002; Cheung and Kinkle, 2005; Ezekoye., et al. 2015, 2017). Conversely, Seklemova., et al. (2001) found that the addition of nutrients had no effect on the remediation of a forest oil soil contaminated with diesel. In this study, natural enhancement increased the bacterial growth and diversity as well as the degradation rate. This was similar with study carried out by Baek., et al. (2006) on Monitoring of microbial diversity and activity during bioremediation of crude oil – contaminated soil with different treatments. (Figure 11).
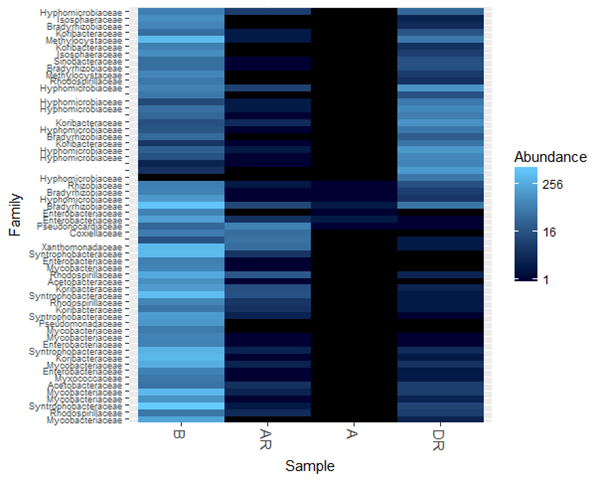
Figure 11: Bacterial community structure at phylum level pre-, during and post remediation
Legend: A; pre-remediation, B: Control, DR; during remediation, AR; post remediation
Legend: A; pre-remediation, B: Control, DR; during remediation, AR; post remediation
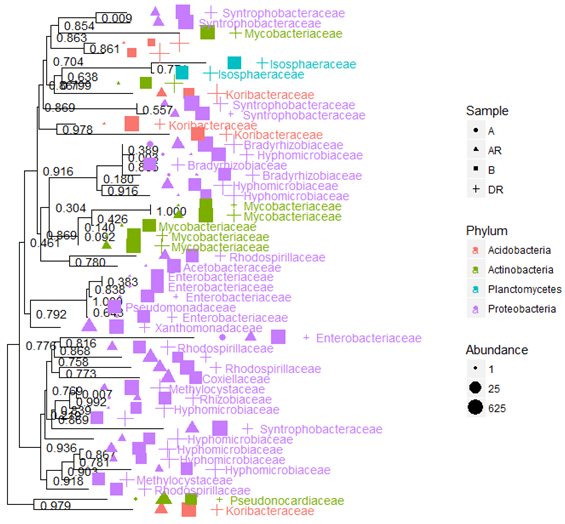
Figure 12: Neighbour – joining tree showing bacterial evolutionary relationships during
bioremediation and contributing samples
Legend: A; pre-remediation, B: Control, DR; during remediation, AR; post remediation
Legend: A; pre-remediation, B: Control, DR; during remediation, AR; post remediation
Conclusion
This research has demonstrated that remediation by enhanced natural attenuation (RENA) of crude oil polluted site resulted in selection of diverse key bacterial populations (Ezekoye., et. al. 2017). The key bacterial populations that are involved in hydrocarbon degradation were identified using Illumina Miseq and API during the study. However, there was a progressive loss of total petroleum hydrocarbon (TPH) and polyaromatic hydrocarbons (PAHs) with concomitant increase in hydrocarbon utilizing bacteria during Remediation by enhanced natural attenuation (RENA) of the polluted site.
This study also showed a shift in bacterial communities (actinobacteria, alpha proteobacteria and gamma proteobacteria were predominant in polluted soil pre-remediation, during remediation and post remediation, respectively) during bioremediation study.
Recommendation
Oil industries should employ the use of high throughput microbial detection techniques during bioremediation projects to improve our understanding of the microorganisms (culturable and non culturable) involved in the degradation of hydrocarbons.
Oil industries should employ the use of high throughput microbial detection techniques during bioremediation projects to improve our understanding of the microorganisms (culturable and non culturable) involved in the degradation of hydrocarbons.
Acknowledgements
The authors wish to thank the indigenes of Okodia-Rumuekpe Yenagoa, Bayelsa State (especially their youths), for their corporation and peaceful access to the crude oil-polluted site during sampling.
The authors wish to thank the indigenes of Okodia-Rumuekpe Yenagoa, Bayelsa State (especially their youths), for their corporation and peaceful access to the crude oil-polluted site during sampling.
References
- Amann RI., et al. “Phylogenetic identification and in situ detection of individual microbial cells without cultivation”. Microbiology and Molecular Biology Reviews 59 (1995): 143-169.
- Boopathy R. “Factors limiting bioremediation technologies”. Bio resource Technology74 (2000): 63-67.
- Crossley DA. “Roles of Microflora and fauna in soil systems”. International Symposium on Pesticides in Soils (1970).
- De Campos SB., et al. “Changes in root bacterial communities associated to two different development stages of canola (Brassica Napus L. Var oleifera) evaluated through next generation sequencing technology”. Microbial Ecology65 (2013): 593-601.
- Duke NC., et al. “Dispersant use and a bioremediation strategy as alternate means of reducing impacts of large oil spills on mangroves: The Gladstone field trials”. Marine Pollution Bulletin 41.7 (2000): 403-412.
- Ebuehi OAT., et al. “Remediation of crude oil contaminated soil by enhanced natural attenuation technique”. Journal of Applied Science Environmental Management9 (2005): 103-105.
- Ezekoye CC., et al. “Bioremediation of Hydrocarbon polluted Mangrove Swamp Soil from the Niger Delta using Organic and Inorganic Nutrients”. British Biotechnology Journal 6.2 (2015): 62-78.
- Ezekoye CC., et al. “Laboratory-Based Bioremediation of Hydrocarbon polluted Mangrove Swamp soil in the Niger Delta using poultry wastes”. Microbiology Research Journal International 19.2 (2017): 1-14.
- Eziuzor CS and Okpokwasili GC. “Bioremediation of hydrocarbon contaminated mangrove soil in bioreactor”. Nigerian Journal of Microbiology 23.1 (2009.): 1777-1791.
- Giovannoni SJ., et al. “Genetic diversity in Sargasso Sea bacterioplankton”. Nature 345 (1990): 60-63.
- Jones DS., et al. “Community genomic analysis of an extremely acidophilic sulphur-oxidizing biofilm”. The ISME journal 6 (2012): 158-170.
- Hamamura N., et al. “Microbial population dynamics associated with crude oil biodegradation in diverse soils”. Applied Environmental Microbiology72 (2006): 6316-6324.
- Hill G., et al. “Methods for assessing the composition and diversity of soil microbial communities”. Applied Soil Ecology15 (2000): 25 - 36.
- Hong C., et al. “Illumina Miseq sequencing investigation on the contrasting soil bacterial community structures in different iron mining areas”. Environmental Science and Pollution Research22 (2015): 10788-10799.
- Hugenholtz P., et al. “Novel division level bacterial diversity in a Yellowstone hot spring”. Journal of Bacteriology 180 (1998): 366-376.
- Kaplan CW and Kitts CL. “Bacterial succession in a petroleum land treatment unit”. Applied Environmental Microbiology70 (2004): 1777-1786.
- Kaschuk G., et al. “Three decades of soil microbial biomass studies in Brazilian ecosystems: lessons learned about soil quality and indications for improving sustainability”. Soil Biology and Biochemistry42 (2010): 1-13.
- Kindt R and Coe R. “Tree Diversity Analysis; A Manual and Software for Common Statistical Methods for Ecological and Biodiversity Studies”. Nairobi World Agroforestry Center 196. (2005).
- Kostka JE., et al. “Hydrocarbon degrading bacteria and the bacterial community response in Gulf of Mexico beach sands impacted by the deep water horizon oil spill”. Applied and Environmental Microbiology77 (2011):7962-7974.
- Leahy JG and Colwell RR., “Microbial degradation of hydrocarbons in the environment”. Microbiology Reviews 54.3 (1990): 305-315.
- Li Y., et al. “Changes in composition and diversity of bacterial communities 13 years after soil reclamation of abandoned mine land in eastern China”. Ecological Research30 (2014): 357-356.
- Lundberg D.S., et al. “Defining the core Arabidopsis Thaliana root micro biome”. Nature 488 (2012): 86-90.
- Maila RM and Cloete TE. “Bioremediation of petroleum hydrocarbons through land farming: are simplicity and cost-effectiveness the only advantage?”. Reviews in Environmental Science and Bio/Technology 3 (2004): 349-360.
- Mason OU., et al. “Metagenome, metstranscriptome and single – cell sequencing reveal microbial response to Deep-water Horizon oil spill”. ISME Journal 6 (2012): 1715-1727.
- McMurdie PJ and Holmes S. “Phyloseq: an R package for reproducible interactive analysis and graphics of micro biome census data”. PLoS ONE 8 (2013): e61217.
- Muyzer G., et al. “Profiling of complex microbial populations by denaturing gradient gel electrophoresis analysis of polymerase chain reaction amplified genes coding for 16S Rrna”. Applied and Environmental Microbiology 59 (1993): 695-700.
- Navarro-Noya Y.E., et al. “Bacterial communities associated with the rhizosphere of pioneer plants (Bahia Xylopoda and Viguiera Linearis) growing on heavy metals- contaminated soils”. Antonie van Leeuwenhoek 97 (2010): 335-349.
- Nikolopoulou M and Kalogerakis N. “Biostimulation strategies for fresh and chronically polluted marine environments with petroleum hydrocarbons”. Journal of Chemical Technology and Biotechnology 84.6(2009): 802-807.
- Odokuma LO and Dickson AA. “Bioremediation of a crude oil – polluted tropical rain forest soil”. Global Journal of Environmental Sciences 2 (2003): 29-40.
- Okpokwasili GC and Odokuma LO. “Tolerance of Nitro bacter to toxicity of some Nigerian crude oils”. Bulletin of Environmental Contamination and Toxicology 52 (1994): 388-395.
- Okpokwasili GC., et al. “Microbes and the Environmental Challenge”. University of Port Harcourt Press Port Harcourt (2006): 31-56.
- Oksanen J., et al. “Package Vegan” Title Community Ecology Package (2016).
- Oksanen J., et al. “The Vegan Package”. Community Ecology Package (2007): 631-637.
- Owugah L. “Oil and trans-national companies in the Niger Delta”. Journal of Development Studies 2.1 (2001).
- Peng R., et al. “Microbial biodegradation of polyaromatic hydrocarbons”. FEMS Microbiology Reviews 32 (2008): 927-955.
- Philp JC., et al.“Bioremediation: Applied Microbial Solutions for Real – World Environmental Cleanup”. American Society for Microbiology (2005): 237-292.
- Polard SJT., et al.“Bioremediation of petroleum and creosote – contaminated soils: a review of constraints”. Waste Management & Research 12 (1994): 173-194.
- Preston-Mafham J., et al. “Analysis of Microbial Community functional diversity using sole-carbon-source utilization profiles-a critique”. FEMS Microbiology Ecology 42 (2002): 1-14.
- Riser – Roberts. “Remediation of Petroleum Contaminated Soils: Biological, Physical and Chemical Processes”. Lewis Publishers (1998).
- Riser – Roberts E. “Remediation of petroleum contaminated soils: biological, physical and chemical processes”. Lewis publishers (1998): 542.
- Roling WFM., et al. “Response of archaeal communities in beach sediments to spilled oil and bioremediation”. Applied Environmental Microbiology 64 (2004): 2614-2620.
- Roling WFM., et al. “Robust hydrocarbon degradation and dynamics of bacterial communities during nutrient-enhanced oil spill bioremediation”. Applied Environmental Microbiology 68 (2002): 5537-5548.
- Sanscartier D., et al. “An investigation of the ability of a 14C-labeled hydrocarbon mineralization test to predict bioremediation of soils contaminated with petroleum hydrocarbons”. Bioremediation Journal 13 (2009): 92-101.
- Torsvik V., et al. “High diversity in DNA of soil bacteria”. Applied and Environmental Microbiology 56 (1990): 782-787.
- Yergeau E., et al. “Metagenomic Analysis of the Bio remédiation of Diesel-Contaminated Canadian High Arctic Soils”. PLoS ONE 7.1 (2012): e30058.
Citation:
Charles Chibueze Ezekoye., et al. “Polyphasic Approach to Bioremediation Monitoring of Crude Oil Impacted-Site in Ikarama
Community, Bayelsa State Using Metabolic Fingerprinting and Illumina Miseq”. Clinical Biotechnology and Microbiology 2.4 (2018):
408-423.
Copyright: © 2018 Charles Chibueze Ezekoye., et al. This is an open-access article distributed under the terms of the Creative Commons Attribution License, which permits unrestricted use, distribution, and reproduction in any medium, provided the original author and source are credited.


 Scientia Ricerca is licensed and content of this site is available under a Creative Commons Attribution 4.0 International License.