Research Article
Volume 1 Issue 5 - 2017
Thermal Degradation of Cu (II) Metallic Soaps and their Characterizations: A Pharmaceutical Application
Department of Chemistry, S.P.C. Govt. College Ajmer-305001, Rajasthan, India
*Corresponding Author: Arun Kumar Sharma, Department of Chemistry, S.P.C. Govt. College Ajmer-305001, Rajasthan, India.
Received: November 09, 2017; Published: November 21, 2017
Abstract
The Cu (II) soaps of caprylic, capric, and lauric acids were synthesized. They were characterized by elemental analysis and Mass
spectroscopy. To study the thermal degradation TGA technique was used. This study shows that two step thermal degradation occurs
in the range of 513K to 713K. Various equations like (CR), (HM) and (BE) were applied to evaluate kinetic parameters like energy of
activation for two steps.
Keywords: Mass spectroscopy; TGA; Energy of activation; Cu (II); Soaps; Caprylate; Caprate; Laurate
Abbreviations: CR: Coats-Redfern; HM: Horowitz-Metzger; BE: Broido equation
Introduction
It is the prime objective of environmental education to make people aware about the importance of protection and conservation of our
environment because indiscriminate release of various pollutants such as surfactants in the environment has created a new facet in the
environmental pollution; because surfactants are either slowly biodegraded or these do not biodegrade at all [1-2]. It is, therefore necessary
to search out some alternate and rapid method for the treatment of these pollutants such as surfactants [3]. Copper is an essential
element present in all organisms both ligand and marine and early literature is rich with investigations concerning the presence of copper
in different forms of life [4]. Surface active agent’s plays an important role in biological as well as industrial process. The physico-chemical
properties of alkaline-earth metal soaps in the solid state have been investigated by several workers [5-6]. Mehrotra studies the infrared,
X-ray and thermogravimetric analysis of calcium palmitate carried out in order to investigate the structure of calcium soaps in the solid
state [7]. Mass spectroscopy provides information about fragmentation process and molecular mass of compound [8].The Mass spectra
for copper caprylate and copper laurate were studied. Thermogravimetry is a valuable technique to establish the kinetic parameters and
the oxidation process [9]. Therefore, the present method is more advantageous because it is more explicit and approachable. Hence this
study has been done to analyse the thermal degradation of Cu (II) caprate using TGA.
Experimental
Firstly Cu (II) caprylate, caprate and laurate soaps were prepared by direct metathesis of standard procedure [10]
Firstly Cu (II) caprylate, caprate and laurate soaps were prepared by direct metathesis of standard procedure [10]
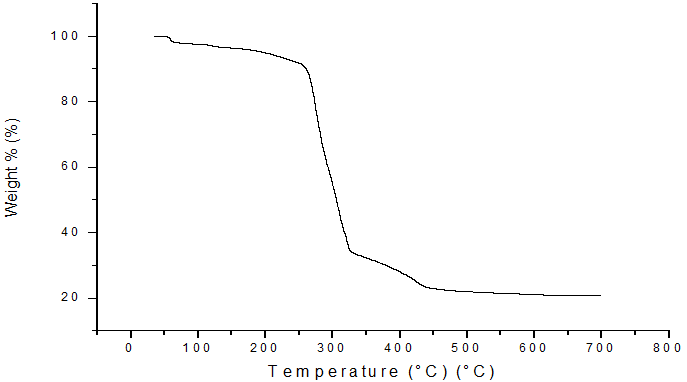
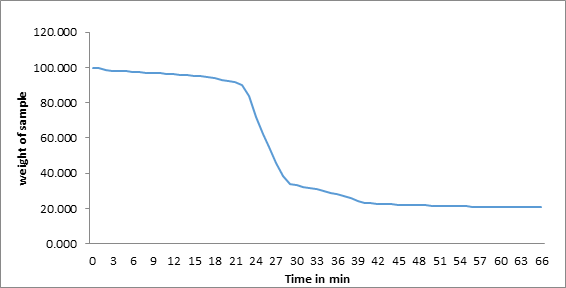
The Mass Spectra were obtaining from CDIR Lucknow U.P. India. The TGA curves of the samples were obtained by TGA analyser from IIT Powai Mumbai. The results were shown as plots of ‘weight loss % v/s temperature’ and ‘weight loss% time.’
Results and Discussion
The synthesized soaps are abbreviated as:
- Copper (II) Caprylate (CCl Soap)
- Copper (II) Caprate soap (CCp Soap)
- Copper (II) Laurate Soap (CLt Soap)
The physical & analytical data of CCl, CCp and CLt soaps are given in Table-1. Determination of metal content followed standard procedures [11].
Mass Spectra
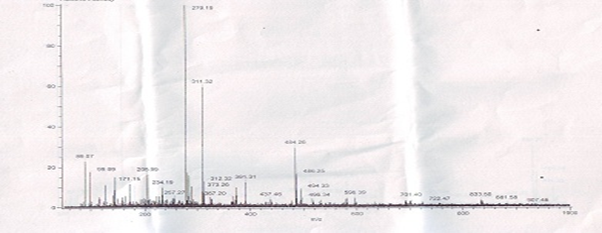
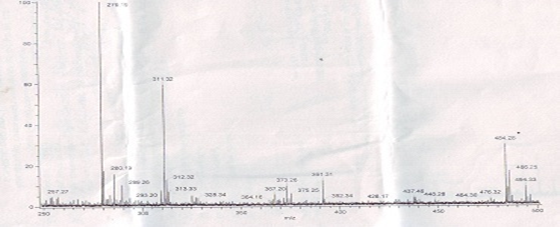
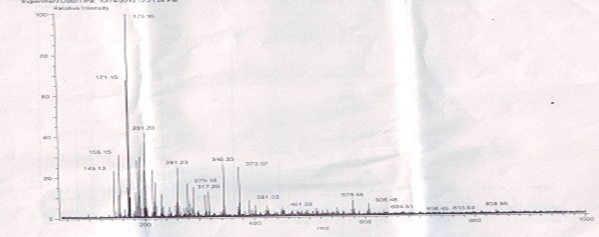
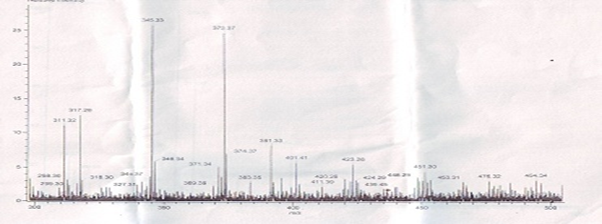
The major peak at m/z obs. (calc.) 364. 16 (347.5) and 453.31 (459.5) in the ESI-MS spectrum could be assigned to the molecular ion peak of Cu (II) caprylate and Cu (II) laurate respectively. The FAB-mass spectra suggested that both soaps have a dimeric nature. These soaps show molecular ion peaks in good agreement with the empirical formula suggested by elemental analyses. The FAB mass spectrum gives additional information about the analyzed species. Similarly the spectrum Figure 1-2 shows a series of peak 311.32, 279.19, 257.27, 234.19, 205.09, and 179.15 corresponding to various fragments of Cu (II) caprylate. Similarly the spectrum Figure 3-4. Shows a series of peak 451.3, 423.28, 391.33, 373.7, 345.33, and 173.16 corresponding to various fragments of Cu (II) laurate [12-13].
The major peak at m/z obs. (calc.) 364. 16 (347.5) and 453.31 (459.5) in the ESI-MS spectrum could be assigned to the molecular ion peak of Cu (II) caprylate and Cu (II) laurate respectively. The FAB-mass spectra suggested that both soaps have a dimeric nature. These soaps show molecular ion peaks in good agreement with the empirical formula suggested by elemental analyses. The FAB mass spectrum gives additional information about the analyzed species. Similarly the spectrum Figure 1-2 shows a series of peak 311.32, 279.19, 257.27, 234.19, 205.09, and 179.15 corresponding to various fragments of Cu (II) caprylate. Similarly the spectrum Figure 3-4. Shows a series of peak 451.3, 423.28, 391.33, 373.7, 345.33, and 173.16 corresponding to various fragments of Cu (II) laurate [12-13].
Thermal Decomposition
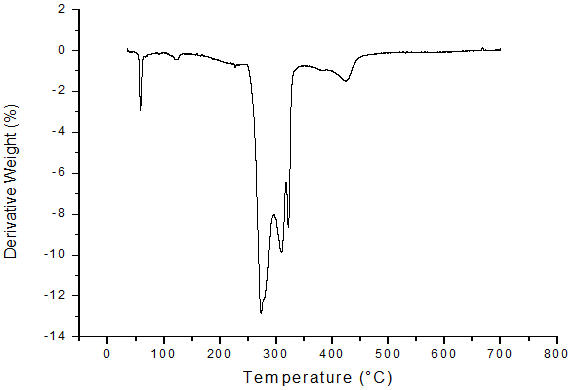
The results from TGA are shown mass loss against temperature for the compound studied. (Figure 5, 6). The TGA curves plotted for CCp that the decomposition observed in two steps, in range of 513K to 713K. The soap decomposes into ketones, Cu2O and CO2. For this system, the weight of final residue is observed to in agreement with the calculated weight of metal oxide from the molecular formula of the soap. It is suggested that the long chain fatty acids converts in to some volatile compounds, which are constantly removed by vapour generated during heating. The DTA curve shows in Figure 7 reveals that endothermic reaction [14-15].
The results from TGA are shown mass loss against temperature for the compound studied. (Figure 5, 6). The TGA curves plotted for CCp that the decomposition observed in two steps, in range of 513K to 713K. The soap decomposes into ketones, Cu2O and CO2. For this system, the weight of final residue is observed to in agreement with the calculated weight of metal oxide from the molecular formula of the soap. It is suggested that the long chain fatty acids converts in to some volatile compounds, which are constantly removed by vapour generated during heating. The DTA curve shows in Figure 7 reveals that endothermic reaction [14-15].
Kinetic Parameters
The results have been applied on various equations like C.R. [2] equation, H.M. [3] equation and B.E. [4] equation to evaluate the energy of activation (E) for thermal degradation. Of the various methods of kinetic analysis, C.R. equation has been found to be the most appropriate in calculating the energy of activation. It shown by equation [16].
The results have been applied on various equations like C.R. [2] equation, H.M. [3] equation and B.E. [4] equation to evaluate the energy of activation (E) for thermal degradation. Of the various methods of kinetic analysis, C.R. equation has been found to be the most appropriate in calculating the energy of activation. It shown by equation [16].
Where ‘a’ is the linear rate of heating and f (α) = – log (1-α) for n = 1
Hence, this equation can be rewritten as –
Hence, this equation can be rewritten as –
Where ‘α’ stands for the fraction of soap decomposed, ‘n’ for the order of the reaction, ‘K’ for the rate constant, ‘E’ for the energy of
activation of the reaction, ‘R’ the gas constant (R = 8.314 J mol-1 K) and ‘A’ for the pre – exponential or frequency factor and is usually
assigned to be independent of absolute temperature ‘T’.
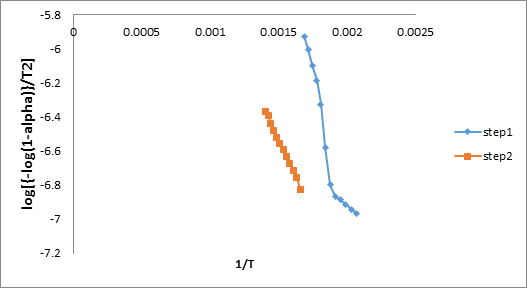
The values of energy of activation using CR equation for each of the two steps for CS system has been evaluated from the linear plots
of ‘log {[– log (1-α)]/ T2} v/s 1/T’. The values of activation energies evaluated from the slope of these plots are recorded in Table –2 and
are observed to be in following order shown in Figure 8:
| Compound | Colour | % Found (Calculated) | |||
| Cu | C | H | O | ||
| (Copper Caprylate) M.W-349.5 |
Blue Green | 18.17 | 54.94 | 8.58 | 18.31 |
| (Copper Caprate) M.W- 405.5 |
Blue Green | 15.66 | 59.19 | 9.37 | 15.78 |
| (Copper Laurate) M.W-461.5 |
Blue Green | 13.76 | 62.41 | 9.96 | 13.87 |
Table 1: Physical and analytical data of Cu (II) Soaps Derived from Caprylate, Caprate, and laurate.
Step II > Step I.
Mention may also be made of the fact that although decomposition is continuous with respect to time and temperature, yet Freeman
– Caroll method is not applicable, as the plots of ‘[log (dw/dt)]/[log Wr]v/s 1/T’ do not pass through the origin confirming that
the order of reaction is not zero.
To confirm the energy of activation, HM equation has been used to evaluate the value of ‘E’ according to the following equation [17].
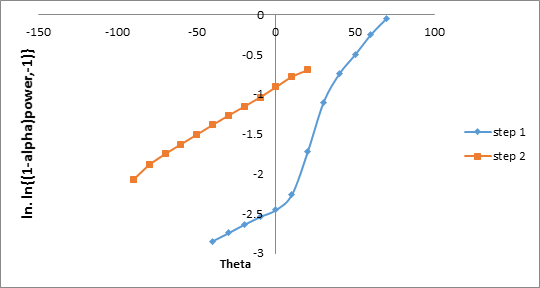
ln [ln (1–α)–1] = E .θ/RT2 (3)
Where ‘α’ is the fraction of soap decomposed at time‘t’, ‘Ts’ is the temperature at which the rate of decomposition is maximum and
‘θ’ is equal to (T–Ts). The energy of activation as recorded in Table – 2 are obtained from the slope of the plot between ln [ln (1–α)-1] v/s
θ. For H.M. equation the values of each step are in the order shown in Figure 9
Step II > Step I
The energy of activation for the stepwise thermal decomposition of all the referred systems has also been calculated by using B.E.
which is as follows [18].
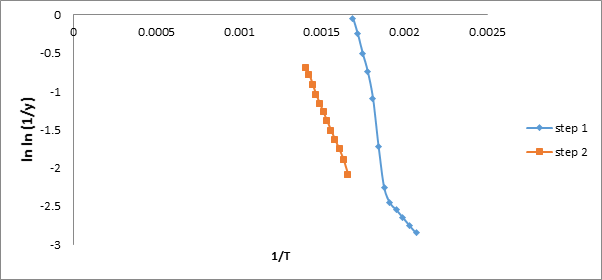
ln [ ln (1/y)] = – E + C/RT (4)
Where ‘y’ is fraction of weight at temperature ‘T’, ‘E’ is the activation energy and ‘R’ is the gas constant in joule mol-1 K-1. The energy
of activation for each step is calculated from the slope of plot between ln [ln (1/y)] and (1/T). The values of activation energies for different
steps of thermal decomposition ofare recorded in Table – 2 and are found to be in the following order and also shown in Figure 10.
Step II > Step I
A perusal of Table – 2 reveals that for all the referred systems, the value of activation energy is highest for the second step and smallest
for the first step; irrespective of the equation applied i.e. the stepwise energy of activation follows the order –
Step II > Step I
| Soap ↓ → Step and equation |
CR equation | HM Equation | BE Equation | ||||
| I | II | I | II | I | II | ||
| Cu Caprate 10°C | 80.0 | 160.6 | 38.8 | 117.5 | 37.2 | 93.4 | |
Table 2: Energy of Activations for the Decomposition Reaction of Copper Caprate Soap.
Conclusion
The extreme use of surfactants has created a new problem in society because they are do not biodegrade. Hence it is important
to find out a faster method for the treatment of these surfactants. Thermal Methods (TGA) provides valuable information about the
removal of the natural soap segments from the environment. This study will play a significant role for pollution controlling towards
Green Chemistry.
Acknowledgement
The authors pay their sincere gratitude to UGC, Principal, S. P. C. Govt. College, Ajmer, Rajasthan (India) for providing necessary research facilities to accomplish this study.
The authors pay their sincere gratitude to UGC, Principal, S. P. C. Govt. College, Ajmer, Rajasthan (India) for providing necessary research facilities to accomplish this study.
References
- Balkose D., et al. Journal of Thermal Analysis and Calorimetry 101.2 (2010): 795.
- KN Mehrotra., et al. Cellulose Chemistry and Technology 9 (1975): 657.
- KN Mehrotra and SK Upadhyaya. Tenside Surfactants Detergents 24(1987): 90.
- Santos JCO., et al. Journal of Thermal Analysis and Calorimetry 75.2 (2004): 419.
- NamiShahab AA., et al. Indian Journal of Chemistry 45 (2006): 1139.
- Sharma AK., et al. Tenside Surfactants Detergents (2017).
- KN Mehrotra and and SK Upadhyaya. Recueil des Travaux Chimiques des PaysBas 106 (1987): 625.
- Moharana SC., et al. Indian Journal of Chemistry 41 (2002): 1569.
- Sharma AK., et al. Journal of Pure and Applied Ultrasonics 39.3 (2017): 92-99.
- Sharma S., et al. journal of the institution of chemists 89.4 (2017).
- Tank P., et al. Global Journal of Pharmacy & Pharmaceutical Sciences 3.4 (2017): 1-6.
- Sharma S., et al. Asian Journal of Green Chemistry 2.2 (2017): 129-140.
- Tank P., et al. Acoustical Society of India 44.2 (2017).
- Khan S., et al. Global Journal of Pharmacy & Pharmaceutical Sciences 3.4 (2017): 1-6.
- Tank P., et al. Journal of Chemical and Pharmaceutical Research 4.2 (2017): 1.
- Coats AW and Redfern JP. Nature 201.4914 (1964): 68.
- Horowitz HH and Metzger G. Analytical Chemistry 35.10 (1963): 1464.
- Broido. Journal of Polymer Science 7.7 (1969): 1761.
Citation:
Arun Kumar Sharma., et al. “Thermal Degradation of Cu (II) Metallic Soaps and their Characterizations: A Pharmaceutical
Application”. Chronicles of Pharmaceutical Science 1.5 (2017): 312-319.
Copyright: © 2017 Arun Kumar Sharma., et al. This is an open-access article distributed under the terms of the Creative Commons Attribution License, which permits unrestricted use, distribution, and reproduction in any medium, provided the original author and source are credited.




 Scientia Ricerca is licensed and content of this site is available under a Creative Commons Attribution 4.0 International License.