Review Article
Volume 2 Issue 1 - 2017
Comparative Study of Different Growth Charts and their Practical Application in Cerebral Palsy
APPC Rehabilitation Center - Alameda de Cartes, 192, Portugal
*Corresponding Author: Maria Antónia Campos, APPC Rehabilitation Center - Alameda de Cartes, 192, Portugal.
Received: October 17, 2017; Published: November 03, 2017
Summary
The main objective of this study was to compare the nutritional status in a group of patientsof Cerebral Palsy, with reference to the growth curves of the Centers for Disease Control and Prevention and the New Growth Curves Specific for Cerebral Palsy. Participated In this study 100 patients with Cerebral Palsy (n = 57 male, n = 43 female), with aged between 2 and 20 years, accompanied at the Center for Rehabilitation of Paralysis Cerebral Oporto.
To evaluate the nutritional status, the percentile of Body Mass Index for Age (BMI/I) and Weight for Age (P/I). The motor severity was classified according to the Classification System of the Global Motor Function, according to the age group in which the individuals were.
When comparing the BMI/I and P/I percentiles among the curves we observed differences in the distribution However, in the BMI percentile, this difference was not significant (p = 0.207). Situation was observed at the P/ I percentile where the difference was significant (p < 0.001). The gravity motor was high since the highest level of the Motor Function Classification System Global - V (Feeds Orally and Tube Fed) was the most representative, both for the total sample (29% and 13% respectively), and for females (32.6% and 23.3%, respectively).
The results showed no difference in the BMI/ I percentile between the two curves. However, the same was not true when comparing the P/ I percentile. We can thus affirm that there are significant differences in the evaluation of patients with Cerebral Palsy according to the growth curves under study.
Keywords: Cerebral palsy; Growth curves; Global motor function classification system
Abstract
The main objective of this study was to compare the nutritional status in a group of people with Cerebral Palsy, with reference to the Growth Charts of the Centers for Disease Control and Prevention and the New Growth Charts Specific for Cerebral Palsy. One hundred patients with Cerebral Palsy (n = 57 males, n = 43 females), aged between 2 and 20 years followed at Centro de Rehabilitation of Paralysis Cerebral do Porto participated in this study. To assess the nutritional status were used Body Mass Index percentiles for age (BMI/A) and Weight for Age (W/A). The motor severity was classified according Gross Motor Function Classification System depending on the age at which individuals were. When comparing the percentiles BMI/A and P/A between the two charts, were observed difference in the distribution of the sample, however, in the percentile BMI/I this differences was not significant (p = 0.207).
The opposite was observed in the percentile P/I in which the difference was significant The motor severity was high, since the higher level of Gross Motor Function Classification System - V (Feeds Orally and Tube Fed) was the most representative, for the entire sample (29% and 13% respectively) as well for girls (32% and 23.3% respectively). The results showed no difference in percentile BMI/I between the two charts. However the same was not found when comparing the percentile of P/I. We can say that there is a significant difference in evaluation of patients with Cerebral Palsy according the growth charts used in this study.
Introduction
Cerebral Palsy (PC) can be described as a group of permanent disorders in the development of movement and posture, which cause limitations in activities and which are attributed to non-progressive disorders that occur during brain development fatal or in childhood. Motor problems on the PC are often accompanied by sensitivity and perception, cognitive abilities, communication and behaviour, by epilepsy and secondary problems at musculoskeletal level [1]. Many PC sufferers have food difficulties, which have as a consequence lesser energy and nutrients, both at the macronutrient level such as micronutrients. Several studies indicate that there is a high prevalence of chronic malnutrition in PC patients due to difficulties [2-6] and that these an inferior development when compared to the of children without chronic health problems [3,4, 7-9]. Growth curves are standard tools to monitor growth and development paediatric. They have a percentile estimate Weight/Age (P/I), Height/Age (E/I) and Mass Index Body/Age (BMI/I) based on the reference population [10,11]. Curves commonly used in practice clinics are those of the Centers for Disease Control and venation (CDC) or those of the World Health Organization (WHO) for boys and girls in the general population.
Both the growth curves of the CDC and the Not seem to be the most appropriate for assessing the Population [12], since they do not have account the level of motor impairment and the culties in food that condition their development [13-15]. In July 2011 the New Curves were published PC Growth [16]. These result of a project carried out by Life Expectancy Project, and are based on the CDC curves, or the percentiles for the age weight, height and BMI for children and adolescents from both sexes, between 2 and 20 years of age. The big difference that they are organized in accordance with the according to the Gross Motor Function Classification System (GMFCS - in the 5 levels of motor impairment), being at level V are divided into two forms of Feed: Feeds Orally or Tube Fed [16]. To date, no reference has been made to the nutritional assessment in PC patients, taking into account basis of comparison of the CDC growth curves and the New Growth Curves Specific to the PC, which motivated the interest in carrying out this study in a population of children/young people with PCs, clients of the Center for Rehabilitation of Cerebral Palsy (CRPCP).
Thus, the objectives of this study were: to compare the nutritional status in a group of PC as reference the CDC growth curves and the New Growth Curves Specific to the PC; characterize the sample according to motor severity; to evaluate the nutritional status of the sample from the curves of the CDC and the New Specific Growth Curves for the PC; identify the difference in nutritional assessment of the PC carriers according to the two curves growth and finally to describe the importance of the use of new curves to assess growth and development in PC carriers.
Methodology
The study included 100 consecutively selected users, with a confirmed clinical diagnosis of PC, both sexes, aged between the ages of 2 and 20 years, followed in the consultations of Nutrition and Physiatry, at the Center for Rehabilitation of Cerebral Palsy (CRPCP). The data were obtained in the Between February and May 2012. The exclusion groups were: individuals with lower ages to 2 or more than 20 years. This criterion was due to that the growth curves of both CDC and the New Growth Curves Specific to the PC do not include these age groups and individuals with unconfirmed clinical diagnosis of PC. To characterize the nutritional status of children/young people, thropometric measurements were made, namely the determination of body weight and height and the calculation of body mass index (BMI). The weight was obtained using a scale/digital chair, Seca® brand, model 944 with precision of 100g.
All users were weighed in light clothing. In the case of individuals without balance in the chair, these were initially weighed at the companion's lap, and later the Stevenson formula was applied [17]. Stature was obtained by measuring with a stadiometer. For individuals with orthostatic balance stature was measured using a stadiometer Seca® brand, model 220 vertical, fixed in awall. The individuals were barefoot with their feet held together, heels against the wall, shoulders relaxed, arms along body and head in flat horizontal of "Frankfort". For those who had no The length of the top of the head was measured to an heel, these being in the decubitus position dorsal surface on a rigid surface, using for this purpose a wooden stadiometer with 150 cm length. In the case of individuals with contractures and scoliosis, the stature was estimated from segmental measurements. The measurement of knee height to heel was is easy to perform and provides a greater degree of accuracy for an estimate of height [18,19]. For obtaining of this, a 100 cm wooden stadiometer was used the subject is lying down, with the left knee and ankle at a 90 degree angle. The caliper stem was aligned and parallel to the long bone of the lower part of the leg (tibia) and over the lateral heel bone (malleolus).After obtaining this measure was applied the formula of Chum lea to estimate height for the different age groups [20].
The BMI was calculated for each of the individuals, from dividing your body weight by the square of your height in kilograms and the height in meters [21]. To classify motor severity in PC carriers the Motor Function Classification System Global (GMFCS) [21-24]. This classification system describes 5
Levels of motor function
Level I- walks without limitations;
Level II-walks with limitations;
Level III - walks using an auxiliary locomotion device;
Level IV-self-mobility with limitations; can use Supporting technology with motor;
Level V- transported in a wheelchair by third parties [22,26].
Level I- walks without limitations;
Level II-walks with limitations;
Level III - walks using an auxiliary locomotion device;
Level IV-self-mobility with limitations; can use Supporting technology with motor;
Level V- transported in a wheelchair by third parties [22,26].
In order to compare the nutritional status, the growth curves of the CDC and the New Curves of Growth Specific for PC, respectively. Statistical analysis: the data obtained were analysed in the program Statistical Package for Social Science® (SPSS), for Windows® version 20. Normality was tested by the Kolmogorov-For the variables BMI/I percentile and percentile P/I, for both curves. The Wilcoxon statistical test was used to verify significance for the BMI/I percentile variables and P/I percentile for both curves. To evaluate the association between the variables, the Pearson’s correlation coefficient. The level of significance for all statistical analysis was 5%.
Results
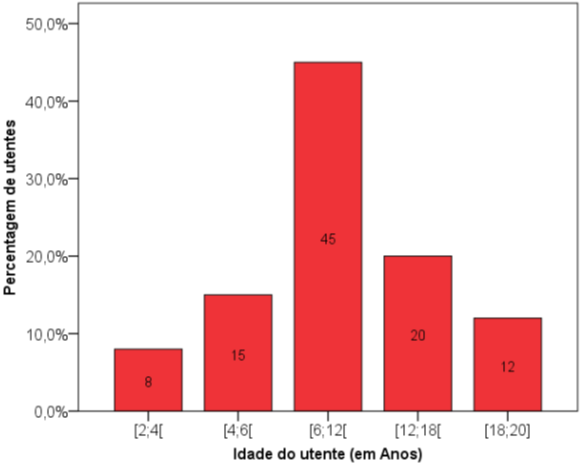
Sample Characterization The total sample (n = 100) had the following characteristics: 57% were males and 43% of the women. From the total sample, the age range between the ages of 6 and 12 years, it was the of patients: 45%, followed by intervals (12-18 years) with 20% (4-6 years) with 15%, (18-20 years) with 12%, and the range with the lowest number of carriers was 2-4 years old with 8% (Graph 1). When we stratify the sample by age group and sex, there was a greater number of female and female carriers (n = 24), as in males (n = 21) in the range of aged 6-12 years. The interval (2-4 years) presented smaller number of carriers and the males had n = 6 and females had only n = 2 (Table 1).
| Idade do utente (em Anos) | |||||||
| [2;4] | [4;6] | [6;12] | [12;18] | [18;20] | Total | ||
| Sexo | Feminino | 2 | 6 | 24 | 8 | 3 | 43 |
| Masculino | 6 | 9 | 21 | 12 | 9 | 57 | |
| Total | 8 | 15 | 45 | 20 | 12 | 100 | |
Table 1: Distribuição da amostra por faixas etárias e sexo.
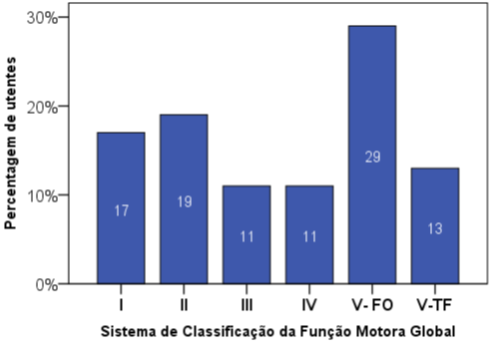
Motor Gravity in (Graph 2), one can observe the characterization of the motor severity, through the 5 levels of GMFCS classification. Level V, Orally Feeds was the representative of the total sample with 29%, followed level II (19%), level I (17%), level V, Tube Fed (13%) and with less representation were found the levels III and IV, both with 11%.
Graph 2: Characterization of the sample regarding motor severity, according to the
Global Motor Function Classification System.
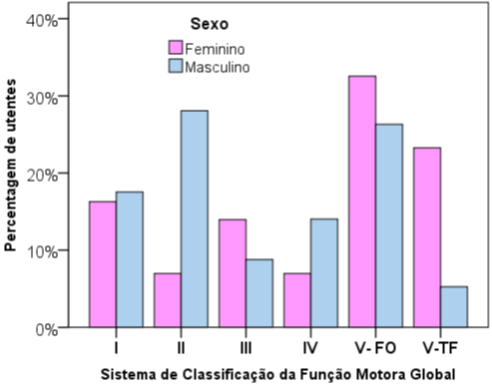
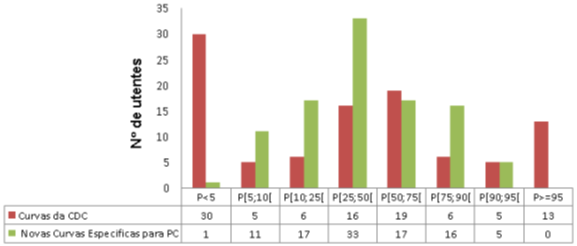
Stratifying the motor classification by sex verified it has been said that either at level V, Feeds Orally as in V, Tube Fed female was the most representative 32.6% and 23.3%, respectively (Chart 3). Classification according to the CDC Curves and the New Specific Growth Curves to the PC the same intervals of percentiles were created in growth curves to compare the distribution of the sample in each of the curves. IMC percentile for age in (Graph 4), the distribution of percentile of BMI/I.
Graph 4: Distribution of the sample for percentiles of Body Mass Index for
age, according to the growth curves of the Centres for Disease Control and
the New Growth Curves Specific to Cerebral Palsy.
According to the CDC curves, it was observed that in the interval Percentile < 5 (P < 5) were a greater number of patients were evaluated (n = 30), while, according to the New Curves of Specific Growth for the PC was only identified one. The same occurred in the interval P ≥ 95 in that according to the CDC curves were identified 13 individuals, while, according to the New Growth Curves Specific to the PC was not identified. Contrary situation was observed in the P 25; 50 in which according to the CDC curves were classified with fewer carriers (n = 16) compared to the New Growth Curves Specific for PC (n = 33).
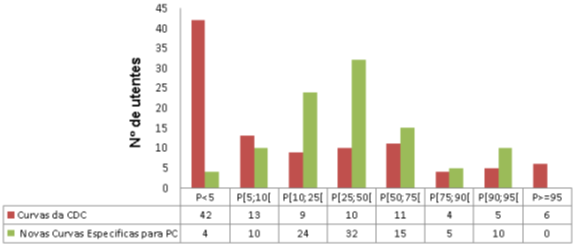
Weight-for-age percentile In (Graph 5), the distribution of weight-for-age percentiles (P/I). According to the curves CDC, it was observed that in the P < 5 interval, a greater number of patients were evaluated (n = 42) while, according to the New Curves of Specific Growth for the PC were identified the same occurred in the interval P ≥ 95 in which second the CDC curves were classified 6 individuals and according to the New Growth Curves Specific to the PC has not been identified. At the intervals P [10; 25] and P [25; 50] according to the curves of the CDC were evaluated a lower number of individuals (n = 9 and n = 10, respectively) while which according to the New Growth Curves Specific for the PC were identified a greater number of carriers (n = 24 and n = 32, respectively).
Graph 5: Distribution of the sample for the percentiles Weight for age,
according to with the growth curves of the Centres for Disease Control
and the New Curves of Growth Specific for Cerebral Palsy.
The Kolmogorov-Smirnov test was applied to verify the normality of the following variables: percentile of BMI/me and P/me for the CDC curves and for the New Growth Curves Specific to the PC, and it was found that these variables did not follow a normal distribution. It was observed that percentiles of BMI/I obtained either by the CDC curves as by the New Specific Growth Curves for CP, presented a strong correlation (r = 0.84; p < 0.001), as well as the P/I percentiles obtained for both curves (r = 0.75, p < 0.001). Non-parametric tests were then applied for paired samples, in order to verify differences between BMI/I and P/I percentiles obtained for the two growth curves. The Wilcoxon test was used to compare the days. For the BMI/I percentiles, a value of BMI/I and P/I between the sexes, the Wilcoxon test and it was found that there were no significant sex, p value = 0.158 and p = 0.422, respectively.
Discussion
This study compared the nutritional status of 100 PC users with reference to the curves of CDC Growth and the New Growth Curves Specific to the PC. Of these, 57% were male and 43% were male and female. In order to classify the motor severity in the PC, the GMFCS establishing 5 classification levels (21-24). Chart 2 shows the distribution of the five levels. The Grade V (Orally Feeds and Tube Fed) which represents the carriers with the most severe clinical condition, grouped 42% of the total sample (29% and 13%, respectively). Identical results were observed in other studies [2,6].
In the stratification of motor gravity by sex a high percentage of fe- minino at the most serious level V (Feeds Orally and Tube Fed) 32.6% and 23.3%, respectively, and the Male was more representative at level II with 28.1%. Similar results were in other studies [2,26].
When we compare the BMI/I percentiles between the two growth curves were observed, that in the CDC curves there were a greater number of CDC with P < 5 (n = 30) while in the New Curves Specific Growth for PC found only 1 carrier. Contrary situation was noted in the range P [25; 50] where CDC curves presented a lower number of carriers in New Growth Curves for PC (n = 16 and n = 33, respectively). We the remaining intervals were also unequal distribution between both curves. Although this inequality, they presented a strong correlation (r = 0.84, p < 0.001). The test of Wilcoxon and it was found that the difference between the percentiles of BMI/I for the curves was not significant (p value = 0.207).
Therefore we can say that assessment of the BMI/I percentile for the curves of the CDC is different from the New Growth Curves Specific to the PC. Regarding the P/I percentile, when we compared he distribution of the sample at intervals, that the CDC curves overestimated individuals with PCs that were with P < 5 and those who found in P ≥ 95, compared with the growth curves specific to the PC. The Wilcoxon statistical test was used to verify the significance of the sample provision between the curves and an extremely high with a value of p < 0.001. We can thus say that there is difference in the of the growth pattern among the carriers and the non-disabled population, and that the curves of CDC appear to underestimate of PC [13,15,32].
Conclusions
The study showed that there are significant differences on the nutritional assessment of PC patients according to the curves of the CDC and the New Curves Specific Growth for the PC. It was observed that in most cases, PC undervalued by the CDC curves. We can like this consider these curves to be inappropriate to use on the PC since they do not take into account level of motor impairment and the difficulties in food that conditions the development of these individuals.
Correct assessment of nutritional status is essential to determine the best intervention and monitoring the growth and evolution of children and adolescents with PC. This study that the New Specific Growth Curves for the PC seem to be the most suitable for this population, since in addition to percentiles for age, weight and height BMI, for children and adolescents of both sexes, between the ages of 2 and 20, also consider the different levels of motor severity and the feed. The studied sample showed a marked severity demonstrated by the percentage of carriers at the highest level of GMFCS -V, Feeds Orally: 29% and Tube Fed: 13%. Despite the sample analysed had a lower prevalence of individual’s females, this subgroup presented greater number of individuals with motor grade degree in the V (Feeds Orally 32.6% and Tube Fed 23.3%).
You can also conclude that the difference in assessment is more the more severe the clinical form of PRAÇA. The use of the new curves as a reference for growth in PC users may be useful for the clinical practice because they allow for more need this population and identify early situations of malnutrition and/or overweight, and may nutritional intervention be more anticipated and adequate. There are few references in the literature on the between the CDC growth curves and the New Growth Curves Specific to the PC. Focusing more studies on this subject may allow a more accurate assessment of the growth in carriers PC using specific criteria for this pathology so particular and heterogeneous.
References
- Bax M., et al.“Proposed definition and classification of cerebral palsy, April 2005.” Developmental Medicine & Child Neurology 47.8 (2005): 571-576.
- Mª Antonia Campos., et al. “Efeito das competências alimentares no estado nutricional de crianças portadoras de Paralisia Cerebral”. Acta Medica Portuguesa 20 (2007): 21-17.
- Stalling VA CE., et al. “Nutrition status and growth of childrenwith diplegic or hemiplegic cerebral palsy”. Developmental Medicine & Child Neurology 35.11(1993): 997-1006.
- Stalling VA CE., et al. “Nutrition-related growth failure of children with quadriplegic cerebral palsy”. Developmental Medicine & Child Neurology 35.2 (1993): 126-138.
- Samson-Fang LJ and Stevenson RD. “Identification of malnutrition in children with cerebral palsy: poor performance of weight-for-height centiles”. Developmental Medicine & Child Neurology 42.3 (2000): 162-168.
- Lisa Samson-Fang., et al. “Relationship of nutritional status to health and societal participation in children with cerebral palsy”. Journal of Pediatrics 141.5 (2002): 637-643.
- Stevenson RD., et al. “Clinical correlates of linear growth in children with cerebral palsy”. Developmental Medicine & Child Neurology 36.2 (1994): 135-142.
- Samson-Fang LJ and Stevenson RD. “Linear growth velocity in children with cerebral palsy”. Developmental Medicine & Child Neurology 40.10 (1998): 689-692.
- Marise Bueno Zonta., et al. “Crescimento eantropometria em paciente com paralisia cerebral hemiplégica”. Revista Paulista de Pediatria 27.4 (2009): 416-423.
- Kuczmarski RJ OC., et al. “CDC growth charts: United States”. Advanced Data 8 (314) (2000): 1-27.
- 2000 CDC Growth Charts for the United States: Methods and Development. Departament of Health and Human Services, Centers for Disease Control and Prevention National Center for Health Statistics, 2002.
- Campos MA. “Curvas de crescimento na Paralisia Cerebral-Quais as Mais Indicadas?” Nutricias 12 (2012): 34-35.
- Krick J M-MP., et al. “Pattern of growth in children with cerebral palsy”. Journal of the American Dietetic Association 96.7 (1996): 680-685.
- Richard D., et al. “Growth and Health in Children with Moderate-to-Severe Cerebral Palsy”. Pediatrics 118.3 (2006): 1010-1018.
- Day SM., et al. “Growth patterns in population of children and adolescents with cerebral palsy”. Developmental Medicine & Child Neurology 49.3 (2007): 167-171.
- Jordan Brooks., et al. “Low Weight, Morbility and Mortality in Children with Cerebral Palsy: New Clinical Growth Charts”. Pediatrics 128.2 (2011): e299-e307.
- Stevenson RD. “Use of Segmental Measures to Estimate Stature in Children with Cerebral Palsy”. Archives of Pediatrics & Adolescent Medicine 149.6 (1995): 658-662.
- Souza KES., et al. “Classificação do grau de comprometimento motor e do índice de massa corpórea em crianças com paralisia cerebral”. Journal of Human Growth and Development 1.1 (2011): 11-20.
- Spender QW., et al. “Assesment of Linear Growth of Children with Cerebral Palsy: Use Alternative Measures to Height or Length”. Developmental Medicine & Child Neurology 31.2 (1989): 206-214.
- Chumlea WC., et al. “Prediction of stature from knee height for black and white adults and children with application to mobility-impaired or handicapped persons”. Journal of the American Dietetic Association 94.12 (1994): 1385-1391.
- WHO. Physical status: the use and interpretation of anthropometry. Report of a WHO Expert Committee. WHO Technical Report Series 854. Geneva: World Health Organization, 1995.
- Palisano R., et al. “Development and reliability of a system to classify gross motor Function in children with cerebral palsy”. Developmental Medicine & Child Neurology 39.4 (1997): 214-223.
- Beckung E. “The natural history of gross motor development in children with cerebral palsy aged 1 to 15 years”. Developmental Medicine & Child Neurology 49.10 (2007): 751-756.
- Reid SM., et al. “Using the Gross Motor Function Classification System to describe patterns of motor severity in cerebral palsy”. Developmental Medicine & Child Neurology 53.11 (2011): 1007-1012.
- Morris C and Bartlett D. “Gross Motor Funcion System: impact and utility”. Developmental Medicine & Child Neurology 46.1 (2004): 60-65.
- Robert J Palisano., et al. “Validation of Model of Gross Motor Funcion For Children with Cerebral Palsy”. Physical Therapy 80.10 (2000): 974-985.
- Jahnson A. “Prevalence and characteristics of children with cerebral palsy in Europe”. Developmental Medicine & Child Neurology 44.9 (2002): 633-640.
- Anónimo. Wwwcensusgov/population/international, aces so no dia 31/03/12.
- Marshalyn Yeargin-Allsopp., et al. “Prevalence of Cerebral Palsy in 8-Year-Old Children in Three Areas of the United States in 2002: A Multisite Collaboration”. Pediatrics 121.3 (2008): 547-554.
- Jarvis S., et al. on behalf of the SCPE collaboration of European Cerebral Palsy Registers. “Case gender and severity in cerebral palsy varies with intrauterine growth”. Archives of Disease in Childhood 90.5 (2005): 474-479.
- Matos AP and Lobo JC. “A paralisia cerebral na adolescência: Resultados de uma investigação”. Psicologia USP 20.2 (2009): 229-249.
- Catalina Le., et al. “Nutrición del Niño con Enfermedades Neurológicas Prevalentes”. Revista chilena de pediatría 81.2 (2010): 103-113.
Citation:
Maria Antónia Campos and Rámula Issã. “Comparative Study of Different Growth Charts and their Practical Application in
Cerebral Palsy”. Nutrition and Food Toxicology 2.1 (2017): 265-273.
Copyright: © 2017 Maria Antónia Campos and Rámula Issã. This is an open-access article distributed under the terms of the Creative Commons Attribution License, which permits unrestricted use, distribution, and reproduction in any medium, provided the original author and source are credited.


 Scientia Ricerca is licensed and content of this site is available under a Creative Commons Attribution 4.0 International License.