Research Article
Volume 1 Issue 4 - 2017
High Frequency Single Crystal Ultrasonic Transducers for High Resolution Ophthalmic Imaging Applications
1School of Physics & Optoelectric Engineering, Guangdong University of Technology, Guangzhou Higher Education Mega Center, Guangzhou 510006, People’s Republic of China
2NIH Resource Center for Medical Ultrasonic Transducer Technology and Department of Biomedical Engineering, University of Southern California, Los Angeles, CA 90089, USA
3Roski Eye Institute, Department of Ophthalmology, University of Southern California, Los Angeles, CA 90033, USA
2NIH Resource Center for Medical Ultrasonic Transducer Technology and Department of Biomedical Engineering, University of Southern California, Los Angeles, CA 90089, USA
3Roski Eye Institute, Department of Ophthalmology, University of Southern California, Los Angeles, CA 90033, USA
*Corresponding Author: Qifa Zhou, University of Southern California, Los Angeles, CA 90033, USA.
#Corresponding Author: Xingui Tang, Guangdong University of Technology, Guangzhou 510006, People’s Republic of China.
Received: October 09, 2017; Published: October 13, 2017
Abstract
As one of the most important and well established tools, ultrasound imaging provides noninvasive valuable diagnostic information, especially in the form of cross-sectional images of soft tissues. In this work, we report the design, fabrication, and characterization of press-focused LiNbO3 transducer. The performance of these transducers is in good agreement with the simulation results. Large bandwidth (92%) and high center frequency (75 MHz) are obtained. The lateral resolution and axial resolution are 110 µm and 13.09 µm respectively. The high resolution imaging capability of the transducer is demonstrated by scanning a pig eyes. The fine structures of pig eye are discernible with these ultrahigh frequency transducers.
Keywords: High frequency; Ultrasound; Ophthalmic imaging; High resolution
Abbreviations: Pb (Zr, Ti)O3: PZT; Pb (Mg1/3Nb2/3)O3-PbTiO3: PMN-PT; LiNbO3: LNO; (K, Na)NbO3: KNN; (Bi, Na) TiO3: BNT; BaTiO3: BT; Bandwidth: BW; Maximum output voltage: Vpp; Ultrasound Biomicroscopy: UBM; the resonance frequency: fr; Anti-resonance frequency: fa; the center frequency: fc
Introduction
Ultrasound has been used in many fields, including chemistry, nuclear physics, biology, medicine, underwater communication technology, materials testing and so on [1-5]. As one of the most important and well established tools, ultrasound imaging provides noninvasive valuable diagnostic information, especially in the form of cross-sectional images of soft issues [6]. Ultrasonic transducers are widely used in medical detection, nondestructive evaluation, sonar and etc. [7,8], and they are typically classified into single element and array transducers, depending on the number of active elements [9,10]. In terms of frequency, ultrasonic transducers can also be categorized into low-frequency, high-frequency (> 20 MHz), based on their center frequencies. Conventional center frequencies of ultrasonic transducers typically work at frequencies below 50 MHz, which provide tens of microns to millimeter spatial resolution [11-15]. In many applications, such as: eye, blood vessels, etc., high-frequency ultrasonic transducers with better resolution are needed, it is essential to use higher frequency ultrasonic transducers with broader bandwidth and higher resolution. The need for improving image resolution has prompted intensive studies in developing high-frequency imaging systems. High frequency ultrasound is currently used for various imaging applications in ophthalmology.
At present, the choice of piezoelectric material for medical transducer are mostly Pb(Zr,Ti)O3 (PZT) based ceramics and relaxor materials Pb(Mg1/3Nb2/3)O3-PbTiO3 (PMN-PT) single crystals due to their superior piezoelectric properties [16-19]. But due to the environment problem, an available alternative of lead free piezoelectric materials have been studied, such as: LiNbO3 (LNO) single crystal, (K,Na)NbO3 (KNN) based ceramics, PVDF, (Bi,Na)TiO3 (BNT) based ceramics, and BaTiO3 (BT) based ceramics, these materials have been investigated and exhibit comparable performance to that of the lead-based material mentioned above [14, 20-22]. Among these lead free materials, the single crystal LNO has some excellent material properties for its use as actuator material. Table 1 shows the properties of LNO single crystal compared with other piezoelectric materials. The mechanical quality factor according to manufacturer's data is in the order of 100,000 which is a factor 50-100 higher than the available hard PZT. Also, the dielectric losses are significant smaller. Further, the high Curie temperature of LNO (about 1210°C) is an interesting property. It enables the possibility to design actuators for a high temperature environment.
| Material | kt | d33 (pC/N) | tanδ | εT33 | V (m/s) | ρ(kg/m3) | Tc (°C) | Z (MRayl) |
| LNO | 0.57 | 38.8 | 0.001 | 40 | 7360 | 4688 | 1210 | 34.1 |
| BZT-BCT [23] | 0.41 | 597 | 0.02 | 2817 | 5133 | 5200 | 93 | 26.7 |
| BSZT [24] | 0.45 | 300 | 0.025 | 1346 | 5040 | - | - | - |
| KNN [25] | 0.28 | 154 | 0.029 | 664 | 5690 | - | 420 | 25.9 |
| PVDF [1] | 0.12-0.15 | -33 | - | 5-13 | 2200 | 1780 | 100 | 3.9 |
| PZT-5A [16] | 0.49 | 374 | 0.02 | 85.5 | 3694 | 7750 | - | 33.7 |
| PMN-PT [16] | 0.67 | 1780 | 0.0036 | 797 | 4608 | 8000 | - | 36.8 |
| PZT-5H [26,27] | 0.51 | 600 | 0.018 | 1470 | 4580 | 7500 | 200 | 30 |
Table 1: Properties of LNO single crystal with other piezoelectric materials.
V: Longitudinal wave velocity, Z: Acoustic impedance, εT33: Permittivity, kt: Electromechanical coupling coefficient, d33: Piezoelectric constant, tanδ: Dielectric loss, ρ: Mass density.
In this work, we report the design, fabrication, and characterization of press-focused LiNbO3 transducer. Large bandwidth (92% at -6dB) and high center frequency (75 MHz) are obtained from pulse-echo response. Simulation and experimentally measured electrical impedance magnitude show highly accordance. The high resolution imaging capability of the transducer is demonstrated by scanning a pig eyes. The fine structures of pig eye are discernible with these ultrahigh frequency transducers.
Experimental Procedure
In this work, 36°Y cut Lithium Niobate single crystal was selected due to its good electromechanical coupling, low dielectric permittivity, high longitudinal wave velocity and high Curie temperature. A Krimboltz, Leedom, and Mattaei (KLM) model-based simulation software PiezoCAD (Sonic Concepts, Woodinville, WA) was used to design the structure of LNO transducer based on the parameters in Table 1. Specific design parameters of the transducers, including the aperture size and proper thickness of acoustic stacks were optimized through KLM 14 model-based simulation software PiezoCAD. The design parameters of LNO transducer are listed in Table 2.
In this work, 36°Y cut Lithium Niobate single crystal was selected due to its good electromechanical coupling, low dielectric permittivity, high longitudinal wave velocity and high Curie temperature. A Krimboltz, Leedom, and Mattaei (KLM) model-based simulation software PiezoCAD (Sonic Concepts, Woodinville, WA) was used to design the structure of LNO transducer based on the parameters in Table 1. Specific design parameters of the transducers, including the aperture size and proper thickness of acoustic stacks were optimized through KLM 14 model-based simulation software PiezoCAD. The design parameters of LNO transducer are listed in Table 2.
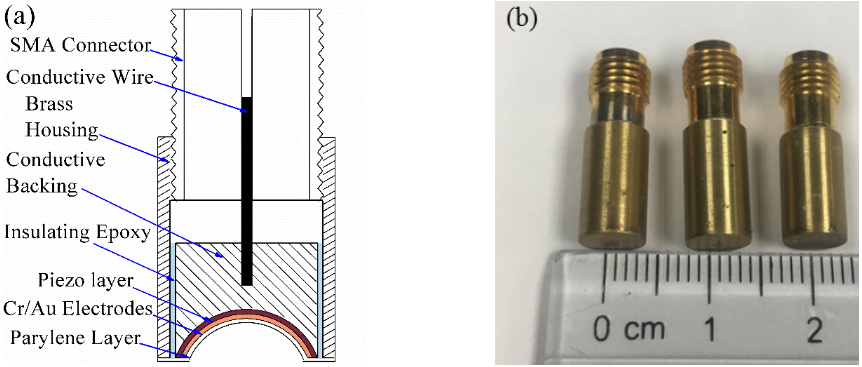
Due to the relative high frequency, one matching layer was made. Firstly, Cr/Au (50/100 nm) electrode were sputtered on one side of LNO single crystal, and LNO element was lapped to the thickness of about 29.5 µm, this lapping process was carried out with extreme care and in a patient manner. After the deposition of Au/Cr as the electrode on the other side of the ceramic sample, the backing layer E-solder 3022 was then cast on this side as the backing material, which was lapped to 1 mm. The stack was then diced into small posts with aperture of 2.5 mm × 2.5 mm using a dicing saw (Tcar 864-1, Thermocarbon, Casselberry, FL). After pressing focus (6 mm), a lead wire was connected to the backing layer with an additional amount of conductive epoxy, and then a subminiature version A (SMA) connector was fixed to the transducer. A layer of Cr/Au (50 nm/100 nm) was sputtered across the element and the housing to form the ground plane connection. Finally, a thin layer of parylene was vapor-deposited on the front face of the transducer, which served as an acoustic matching layer and a protection layer. Figure 1 showed the schematic fabrication flow of designed transducer structure (a) and prepared transducers (b).
| Layer | Piezo Layer | Matching Layer | Backing Layer |
| Material | LiNiO3 Single Crystal | Parylene | E-Solder 3022 |
| Thickness | 29.5 μm | 7.5 μm | 1 mm |
| Acoustic impedance | 34.1 MRayls | 2.6 MRayls | 5.9 MRayls |
Table 2: Parameters of the components of LNO transducer.
Results and Discussions
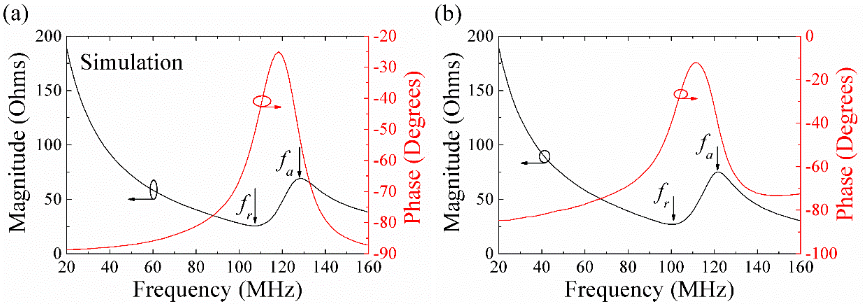
The electrical impedance characteristics of the transducer were measured by an electric impedance analyzer (HP 4294A, Agilent Technologies, Santa Clara, CA). Figure 2 shows the simulation (a) and experimentally measured (b) electrical impedance magnitude and phase of LNO transducer as a function of frequencies in air. From simulation results: the resonance frequency (fr) and anti-resonance frequency (fa) of the transducer are about 107 MHz and 128 MHz, respectively. For experimentally measured impedance results, it is observed that the resonance frequency (fr) and anti-resonance frequency (fa) of the transducer are about 100 MHz and 120 MHz, respectively. Clearly, experimentally measured impedance shows highly agreement with simulation results.
Figure 2: (a) Simulation and (b) measured electrical impedance magnitude and phase of LNO transducers.
In addition, a conspicuous peak in the phase curve is observed both in simulation and measured results. At around 110 MHz, a peak appeared in measured phase curves, it matches well with simulation results (peak in the phase curve: 118 MHz). At the frequency of measured phase curve peak, the electrical impedance is about 40 Ω, which was very close to 50 Ω required by electrical impedance matching of system. The negative phase (-12º) shows the capacitive nature of the device.
According to the IEEE standard, the thickness mode electromechanical coupling coefficient (kt) should be given by:
where fr and fa are the resonant frequency (frequency of minimum impedance) and anti-resonant frequency (frequency of maximum impedance) respectively [2,18,28]. According to above equation, kt is calculated to be 0.606, which is in agreement with the kt of LiNiO3 reported elsewhere.
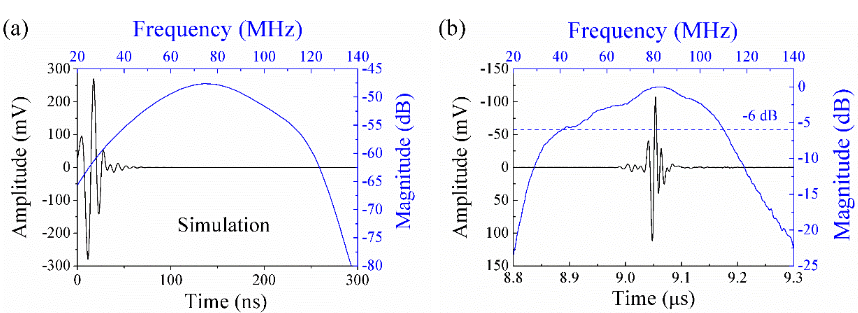
Figure 3: (a) Simulation and (b) measured pulse-echo waveform and frequency spectrum of LNO transducers.
The time domain pulse-echo response and normalized frequency spectrum of the modified LNO transducer are shown in Figure 3. The transducer is connected to a JSR Ultrasonics DPR 500 (Imaginant, Pittsford, NY) pulser/receiver and excited by an electrical impulse at 200 Hz repetition rate and 50 Ω damping. The energy involved is 2.3 µJ and no gain was applied in excitation or reception. An X-cut quartz plate is placed at the focal point as a target. The center frequency (fc) and -6 dB fractional bandwidth (BW) are determined by [23]: fc = (f1 + fu)/2, BW = (fu-f1)/fc × 100%, where f1 and fu are defined as lower and upper -6 dB frequencies, respectively, at which the magnitude of the amplitude in the spectrum is 50% (-6 dB) of the maximum. According to above equations, the measured central frequency of the transducer is about 75 MHz, which shows lower values comparing with the electrical impedance, the deviation should be closely to attenuation. The fractional bandwidth at -6 dB is approximately 92%, which is much higher than previous reports of high frequency transducers [18, 29]. The focal length calculated from pulse-echo response is about 6.5 mm, which shows good agreement with our press focus. And the maximum output voltage (Vpp) of the unamplified pulse echo is about 0.22 V using the pulser/receiver with 2.3 μJ energy setup.
The imaging capability of the LNO transducer is studied by scanning wire phantom and porcine eyeball. In this study, a customized ultrasound biomicroscopy (UBM) system is used. The transducer is driven by a motor controller card (DMC-1802; Galil Motion Control Inc., Mountain View, CA), which also generat a signal to trigger data acquisition. The Panametrics 5900PR pulser/receiver is used to excite the transducer. A logarithmic compression algorithm is used to improve gray scale visualization of the image. Each 2-D frame of image data is obtained by scanning the transducer and collecting pulse-echo lines at 5 μm spacing. Firstly, a 20-μm-diameter tungsten wire phantom (California Fine Wire Company, Grover Beach, CA) is used for this measurement. The three phantom wires are arranged diagonally with equal distance in the axial (1.8 mm) and lateral (0.65 mm) directions. The pulse-echo image is acquired as the transducer scanned across the wire phantom placed in degassed water.
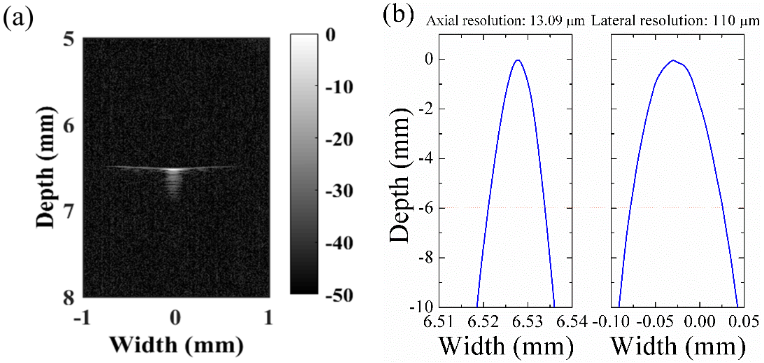
Figure 4: (a) Wire phantom images of LNO transducers with dynamic range of 50 dB, (b) axial resolution, and lateral resolution of LNO transducers.
Ultrasonic transducers with frequency higher than 30 MHz yield improve spatial resolution at the expense of a reduced depth of penetration. The resolution of ultrasound image is determined by the pulse bandwidth (axial resolution, Raxial) and the beam width (lateral resolution, lateral). Simple expressions for the ideal lateral and axial resolution of a focused transducer within the focal zone are given by [1,11]: Axial resolution (-6dB): Raxial = λ/2BW = C/2fcBW; Lateral resolution: Rlateral = λF#, where C is the speed of sound in the medium, fc is the center frequency of the transducer, BW is the bandwidth of the transducer, F# is the f-number (the ratio of focal distance to aperture dimension) and λ the wavelength. Thus, for a fixed number of cycles per pulse, an increase in frequency would result in a reduction in wavelength and pulse duration (increase in BW) [1].
Figure 4(a) shows the images generated using the LNO transducer with a dynamic range of 50 dB. Axial and lateral beam profiles are shown in Figure 4(b). At about 6.5 mm, the -6 dB axial and lateral resolutions for the needle transducer were 13.09 μm and 110 μm, respectively. The measured axial resolution is in approximate agreement with the theoretically predicted axial resolution of 10.5 μm.
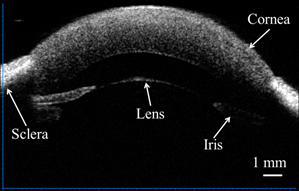
In addition, a porcine eyeball is imaged using this transducer. The porcine eyeball specimen as well as the structure diagram of its eye is presented in Figure 5 the anterior portion image of the porcine eye is conducted with a dynamic range of 90 dB. As shown in Figure 5, the anatomy of porcine eye including the cornea, iris, sclera, lens and iris can be clearly visualized. This image displays a good single-to-noise ratio. These promising results demonstrate that the transducer has very good performance.
Conclusions
In this work, we report the design, fabrication, and characterization of press-focused LiNbO3 transducer. The performance of these transducers are in good agreement with the simulation in terms of center frequency, bandwidth. And wide bandwidth (92%) and high center frequency (75 MHz) are obtained. wire imaging of the transducers shows a lateral resolution of 110 µm and an axial resolution of 13.09 µm. The high resolution imaging capability of the transducer is demonstrated by scanning a pig eyes. The fine structures of pig eye are discernible with these ultrahigh frequency transducers.
Acknowledgements
This work was supported by the National Institute of Health under grant R01-EB10090 and P41-EB002182, the National Natural Science Foundation of China (Grant No. 11574057), the Science and Technology Program of Guangdong Province of China (Grant No. 2016A010104018).
This work was supported by the National Institute of Health under grant R01-EB10090 and P41-EB002182, the National Natural Science Foundation of China (Grant No. 11574057), the Science and Technology Program of Guangdong Province of China (Grant No. 2016A010104018).
References
- Zhou Q., et al. "Piezoelectric films for high frequency ultrasonic transducers in biomedical applications" Progress in Materials Science 56.2 (2011): 139-174.
- Wang K., et al. "An imaging model incorporating ultrasonic transducer properties for three-dimensional optoacoustic tomography". IEEE Transactions on Medical Imaging30.2 (2011): 203-214.
- Silverman R H. "High-resolution ultrasound imaging of the eye - a review". Clinical & Experimental Ophthalmology 37.1 (2009): 54-67.
- Kolkman R G., et al. "Real-time in vivo photoacoustic and ultrasound imaging". Journal of biomedical optics 13.5 (2008): 050510.
- Taghaddos E., et al. “Lead-free piezoelectric materials and ultrasonic transducers for medical imaging”. Journal of Advanced Dielectrics 5.2 (2015): 1530002.
- Hsu H-S., et al. “Focused high frequency needle transducer for ultrasonic imaging and trapping”. Applied Physics Letters101.2 (2012): 024105.
- Aristizábal O., et al. “44-MHz LiNbO/sub 3/transducers for UBM-guided Doppler ultrasound”. IEEE Trans Ultrason Ferroelectr Freq Control 50.6 (2003): 623-630.
- Spedicato L., et al. “Clustering and PCA for reconstructing two perpendicular planes using ultrasonic sensors”. International Journal of Advanced Robotic Systems 10.4 (2013): 210.
- Cannata J M., et al. “Design of efficient, broadband single-element (20-80 MHz) ultrasonic transducers for medical imaging applications”. IEEE transactions on ultrasonics, ferroelectrics, and frequency control 50.11 (2003): 1548-1557.
- Ketterling J A., et al. “Design and fabrication of a 40-MHz annular array transducer”. IEEE transactions on ultrasonics, ferroelectrics, and frequency control 52.4 (2005): 672-681.
- Ma T., et al. “Systematic study of high-frequency ultrasonic transducer design for laser-scanning photoacoustic ophthalmoscopy”. Journal of Biomedical Optics 19.1 (2014): 16015.
- Amini M H., et al. “A New High-Temperature Ultrasonic Transducer for Continuous Inspection”. IEEE Trans Ultrason Ferroelectr Freq Control 63.3 (2016): 448-455.
- Wang D., et al. “Fabrication and characterization of annular-array, high-frequency, ultrasonic transducers based on PZT thick film”. Sensors and Actuators A: Physical 216 (2014): 207-213.
- Brodal E., et al. “Performance of an Ultrasonic Imaging System Based on a 45-MHz Linear PVDF Transducer Array: A Numerical Study”. Advances in Acoustics and Vibration 2011 (2011): 1-15.
- Wong C M., et al. “Development of a 20-MHz wide-bandwidth PMN-PT single crystal phased-array ultrasound transducer”. Ultrasonics 73 (2017): 181-186.
- Kim K B., et al. “Fabrication and comparison of PMN-PT single crystal, PZT and PZT-based 1-3 composite ultrasonic transducers for NDE applications”. Ultrasonics 50.8 (2010): 790-797.
- Chen X., et al. “Simulation and fabrication of 0–3 composite PZT films for ultrahigh frequency (100–300 MHz) ultrasonic transducers”. Journal of Applied Physics 119.9 (2016): 094103.
- Yue Q., et al. “Fabrication of a PMN-PT single crystal-based transcranial Doppler transducer and the power regulation of its detection system”. Sensors14.12 (2014): 24462-24471.
- Zhang S., et al. “Characterization of Mn-modified Pb(Mg(13)Nb(23))O(3)-PbZrO(3)-PbTiO(3) single crystals for high power broad bandwidth transducers”. Applied Physics Letters 93.12 (2008): 122908.
- Bah M., et al. “Ultrasonic transducers based on undoped lead-free (K0.5Na0.5)NbO3 ceramics”. Ultrasonics 63 (2015): 23-30.
- Chen J., et al. “Bandwidth improvement of LiNbO3 ultrasonic transducers by half-concaved inversion layer approach”. Review of Scientific Instruments 83.11 (2012): 114903.
- Chan H L W., et al. “Bismuth sodium titanate based lead-free ultrasonic transducer for microelectronics wirebonding applications”. Ceramics International 34.4 (2008): 773-777.
- Yan X., et al. “Lead-free intravascular ultrasound transducer using BZT-50BCT ceramics”. IEEE Trans Ultrason Ferroelectr Freq Control 60.6 (2013): 1272-1276.
- Lee S T., et al. “High-frequency ultrasonic transducer based on lead-free BSZT piezoceramics”. Ultrasonics 51.7 (2011): 811-814.
- Hagh N M., et al. “Lead-free piezoelectric ceramic transducer in the donor-doped K 1/2 Na 1/2 NbO 3 solid solution system”. IEEE Trans Ultrason Ferroelectr Freq Control 55.1 (2008): 214-224.
- Liu C., et al. “High-frequency (50–100MHz) medical ultrasound transducer arrays produced by micromachining bulk PZT materials". Ultrasonics Symposium (2008): 690-693.
- Liu D., et al. “Broadband and high sensitive time-of-flight diffraction ultrasonic transducers based on PMNT/epoxy 1-3 piezoelectric composite”. Sensors 15.3 (2015): 6807-6817.
- Fei C., et al. “Ultrahigh Frequency (100 MHz-300 MHz) Ultrasonic Transducers for Optical Resolution Medical Imagining”. Scientific Reports 6 (2016): 28360.
- Chen Y., et al. “High performance relaxor-based ferroelectric single crystals for ultrasonic transducer applications”. Sensors 14.8 (2014): 13730-13758.
Citation:
Qifa Zhou., et al. “High Frequency Single Crystal Ultrasonic Transducers for High Resolution Ophthalmic Imaging Applications”.
Ophthalmology and Vision Science 1.4 (2017): 135-141.
Copyright: © 2017 Qifa Zhou., et al. This is an open-access article distributed under the terms of the Creative Commons Attribution License, which permits unrestricted use, distribution, and reproduction in any medium, provided the original author and source are credited.







 Scientia Ricerca is licensed and content of this site is available under a Creative Commons Attribution 4.0 International License.