Research Article
Volume 3 Issue 2 - 2020
Correlation Between 2D Speckle Tracking Echocardiography with Non-Diagnostic ECG and Cardiac Enzymes in Assessment of Myocardial Ischaemia
Departments of cardiology and clinical pathology, Alazhar university, PAMCC, KSA
*Corresponding Author: Abdulaziz Aboshahba MD, Doctor of medicine in cardiovascular medicine, Cardiology department, AlAzhar University, PAMCC, KSA.
Abstract
Background: The assessment of left ventricular (LV) strain using two-dimensional speckle-tracking echocardiography increases the sensitivity for detecting myocardial ischemia compared to the visual assessment with RWMA so increase the detection of patients with acute coronary syndrome.
Aim of the work: To correlate 2D speckle tracking echocardiography with non-diagnostic ECG and cardiac enzymes in evaluation of myocardial Ischaemia.
Patients and Methods: The study conducted on 100 patients (64 males and 36 females) with suspected ACS and non-diagnostic ECG and normal levels of cardiac troponin, all patients underwent conventional, 2D STE and coronary angiography. We excluded all patients with RWMA at rest. The data was analysed using MedCalc software using ROC curve and Correlations methods.
Results: There was significant reduction in global longitudinal and circumferential strains in the patients with ACS in comparison to patients with normal coronary angiography (P value <0.0001 and 0.01) respectively with a sensitivity and a specificity of 97% and 69% for GLS and a sensitivity and a specificity of 70% and 84% respectively for GCS. The territorial longitudinal and circumferential strains at LAD, LCX and RCA territories did not differ significantly in patients with CAD whatever the coronary lesion.
Conclusion: 2D STE can be used as screening test for the evaluation of patients with suspected ACS with excellent sensitivity and good specificity especially the GLS in comparison to GCS. Normal GLS can exclude patients with CAD in the setting of acute chest pain care. Also 2DSTE cannot predict the culprit artery in patients with ACS.
Key words: ACS, 2D STE , GLS , GCS
Abstract
Patients with suspected acute coronary syndrome (ACS) are a heterogeneous group with typical or atypical chest pain, prolonged discomfort, shortness of breath, or abdominal complaints. As long as these patients do not present a typical change in electrocardiography (ECG) or myocardial enzymes, it may be complex to de ne the scope of non-cardiac cause.
The identification of patients at high risk for acute coronary syndrome in ED using conventional assessment of clinical symptoms, electrocardiogram (ECG), and cardiac enzymes is frequently challenging.
Thus, diagnostic tools to rule out a relevant coronary artery disease (CAD) in the setting of a chest pain unit (CPU) are desirable also with respect to increasing healthcare costs.
The misdiagnosis or over diagnosis of patients with acute chest pain can be associated with serious clinical events or a waste of medical resources, respectively. [1]
The myocardial deformation imaging by strain echocardiography has been introduced as an accurate tool for evaluation of left ventricular (LV) deformation during myocardial ischemia. [2]
The assessment of left ventricular (LV) strain using two-dimensional speckle-tracking echocardiography increases the sensitivity for detecting myocardial ischemia compared visual assessment with RWMA. [3]
Aim of the Study
To correlate 2D speckle tracking echocardiography accuracy with non-diagnostic ECG and cardiac enzymes in evaluation of significant myocardial Ischaemia using global & regional longitudinal & circumferential strains in patients with suspected ACS and non-diagnostic ECG & cardiac biomarkers and to differentiate between significant CAD and non-cardiac complaints regarding results of Coronary angiography.
Patients and Methods
This is a prospective observational study that included 826 patients with symptoms suggestive of acute coronary syndrome who were referred to the Emergency Department of Al-Hussein University hospital from October 2016 to September 2017.We excluded 126 patients with suboptimal echocardiographic views , 195 patients with subsequent dynamic ECG changes, 112patients with elevated troponin, 130 patients with relevant RWMA detected during hospital stay, 140patients with past history of myocardial infarction , 10 patients with Atrial fibrillation , 8 patients who refused coronary angiography and 55 patients with impaired systolic function EF less than 50%.
The study comprised 100 patients (64 males (64%) and 36 females (36%)).
According to the coronary angiography findings the studied population were classified into two groups:
- Group (1) Included 26 patients with normal coronary angiography or non-significant coronary artery disease {18 males and 8 females with mean age 60.2±8.02 years}.
- Group (2) Included 74 patients with significant coronary artery disease {46 males and 28 females with mean age 56.91±7.63 years}.
Patients were selected according to the following criteria:
- Inclusion Criteria:
Patients with suspected ACS presenting with typical (retrosternal pressure or heaviness (angina) radiating to the left arm, neck, or jaw, which may be intermittent (usually lasting for several minutes) or persistent) or atypical chest pain (epigastric pain, indigestion, stabbing chest pain, chest pain with some pleuritic features, or increasing dyspnoea) according to ESC guideline in NSTEMI 2015. - Exclusion Criteria:
History of confirmed CAD (Percutaneous Coronary intervention, Coronary artery bypass graft, history of myocardial infarction and Computed tomography coronary angiography),regional wall motion abnormalities suggestive of CAD by two-dimensional Echocardiography, elevated cardiac troponin I, non-cardiac chest pain ,moderate or severe valvular heart disease, atrial fibrillation, congestive heart failure, cardiomyopathy, congenital heart disease and poor Echo window.
Methods
All studied population were subjected to the following:
- 1. Informed verbal consent.
- 2. Full history taking as regard Chest pain analysis to confirm possibility of ACS and exclude non-cardiac chest pain by accurate analysis of chest pain and to determine it is typical or not by determination of site , characters, onset, duration , radiation , aggravating and relieving factors and any associated illness
- 3. General examination and cardiac examination including:
- A) Vital signs.
Blood pressure (BP). Systolic and diastolic BP was measured, blood pressure less than 140/90 is considered normotensive. - B) Evaluation of signs suggestive of non-cardiac complain as chest tenderness, pericardial or pleural rub, crepitation over chest caused by pneumonia.
- C) Cardiac examination to evaluate the presence of MI related complication and evaluation of pulmonary edema and rales which may complicate ACS.
- 4. Resting 12 lead Electrocardiography (ECG): ECG recorded for analysis of rate, rhythm, BBB and chamber enlargement and ECG criteria of ischemic heart disease to exclude patients with specific ECG changes as ST segment elevation typical of MI, Significant ST segment depression more than 1 mm, new onset LBBB and T wave inversion typical for ischemia if exceeding 3mm in depth. [4]
- 5. Cardiac biomarkers evaluation:
Withdrawal of 5 ml blood sample after onset of maximum chest pain by 6 hours and quatification of hs troponin I using Siemens Troponin kits. [5] - 6) Echocardiographic examination:
- I) Conventional 2D Transthoracic Echocardiography:
All the patients were examined in the left lateral decubitus position. Standard 2D TTE examination were performed with a "Philips iE33 X Matrix" ultrasound machine using "S5-1" & "X5-1" matrix array transducers (Philips Medical Systems, Andover, USA) equipped with STE technology, using a multi frequency (1- 5 MHz). ECG-gated examination mostly used to help us during image acquisition & later analysis. - First, default machine settings (focus, zoom, frame rate, gain, compression etc.) were adjusted in order to improve the image quality, if needed. Then, the following data were obtained:
- M-mode modality was taken from parasternal long axis view to measure linear internal dimension of LV (left ventricular end diastolic and end systolic diameters). It is carefully obtained perpendicular to the left ventricular long axis, and measured at the level of the mitral valve leaflet tips. [6]
- Ejection fraction (EF) was calculated from estimation of end diastolic volume (EDV) and end systolic volume (ESV) from apical 2 and apical 4 chambers views using the following formula: EF = (EDV – ESV) / EDV (Modified Simpson’s method). [6]
- II) 2-D Speckle tracking echocardiography study:
The following views were taken for later analysis; apical 4 chamber view, apical 2 chamber view and apical long axis view. Tracking quality was visually checked, corrected when needed, and accepted by the operator. Strain values of LV were assessed automatically in 17 segments, and then averaged automatically as mean value of each strain and presented as global longitudinal strain (LVGLS). [6] - Peak systole was defined as aortic valve closure in the apical long-axis view automatically. Automated delineation of endocardial borders was obtained through marking the mitral annulus level and at the apex on each digital loop. The area of interest was manually adjusted if automated delineation was not optimal. Segments with poor image acquisition or artifacts were excluded due to inability to measure LS. [6]
- Also the following views were taken for later analysis; basal short axis view at level of tip of mitral valve leaflets, mid short axis view at level of papillary muscles and apical short axis view at level of apex distal to papillary muscle level just proximal to the level at which LV cavity end systolic obliteration occurs. [7]
- Tracking quality was visually checked, corrected when needed, and accepted by the operator. Strain values of LV were assessed automatically in 16 segments, and then averaged manually by the operator as mean value of each strain and presented as global circumferential strain (LVGCS).
- Automated delineation of endocardial borders was obtained through marking the endocardial and epicardial borders. The area of interest was manually adjusted if automated delineation was not optimal. Segments with poor image acquisition or artifacts were excluded due to inability to measure CS
- Segmental starin of the LV was calculated according to the territorial blood supply as we included all anterior, anteroseptal, apicoanterior, apicolateral apicoseptal and apicoinferior and mid inferoseptal walls (segments 1,2,7,8,9,13,14,15,16) to the LAD territories, also we included the anterolateral and inferolateral segments (5,6,11,12) to LCX territories ,then we included the basal inferoseptal and mid, basal inferior walls (3,4,10) to RCA territories so the LAD supplies 9 segments , RCA supplies 3 segments and LCX supplies 4 segments , and the sum of segments included to each patient were 16 segment with the exclusion of the segment number 17. [6]
- We summed the strain of the segments belonging to each territory and divided the value by the number of segments to get the mean of starin in each territory. [8]
- 7) Coronary Angiography:
Coronary angiography was performed by using standard (Judkins) technique, using digital imaging acquisition and storage for all patients. Cine loops in multiple angles were stored, and all analyses were performed in retrospect by a single experienced invasive cardiologist, blinded to the results of the echocardiographic analyses. [9] - The data were expressed as a presence or absence of stenosis of left circumflex artery (LCX), left anterior descending (LAD) or right coronary arteries (RCA). Obstruction more than 70% was considered to be significant stenosis. It should be noted that the study protocol did not include routine revascularization and was just performed on clinical indications. [10]
Statistical Analysis
The data from angiography and STE were documented. The ability of STE to detect the presence of ischemia and the involved territory was assessed by comparing the results to angiographic findings (the gold standard). The data were collected & coded using Microsoft Office Excel Worksheet while statistical analysis revised, organized, tabulated and statistically analyzed using MedCalc version 17.7.2 for windows. Data were presented as the mean ± Standard Deviation (SD), frequency, and percentage. Categorical variables were compared using the Chi-square (χ2) and Fisher's exact tests (if required). Continuous variables were compared by the Student t test (two-tailed) and one – way ANOVA test for parametric data with Bonferroni post hoc test to detect differences between subgroups.
Correlations between continuous variables are presented as Pearson correlation coefficient (r =0.4–0.6) is a reasonable correlation, (r =0.6–0.8) is a high correlation, (r = 0.8–1.0) a very high correlation.
P value < 0.05 is considered statistically significant; P < 0.01 is considered highly statistically significant result.
Result
Patients with symptoms suggestive of acute coronary syndrome (n=876) referred to Emergency Department of PAMCC, KSA were screened for study enrolment prospectively, We exclude 126 patients with sub-optimal echocardiographic views , 195 patients with subsequent dynamic ECG changes, 112 patients with elevated troponin, 130 patients with relevant RWMA detected during hospital stay, 140 patients with past history of myocardial infarction , 10 patients with Atrial fibrillation , 8 patients refuse coronary angiography and 55 patients with impaired systolic function EF less than 50%.
This study was a prospective study in which includes 100 patients were classified according to coronary angiography results into two groups:
- Group (1): Included 26 patients with normal coronary angiography which represent 26% of studied patients, Mean ± SD of their age was 60.2 ± 8.02 years, there were 18 males (69.2%), and 8 females (30.8 %).
- Group (2): Included 74 patients with significant coronary artery disease which represent 74% of the studied patients, Mean ± SD of their age was 56.91 ± 7.63 years, there were 46 males (62.1 %), and females (37.9%).
There was no statistically significant difference between the two groups as regard age, gender, smoking, HTN and DM (table1)
| Variables | Group 1 (N=26) | Group 2(N=74) | P | |
| Sex | Male | 9 (69.2%) | 23 (62.1%) | 0.695 |
| Female | 4 (30.8%) | 14 (37.9%) | ||
| HTN | No | 5(38.5%) | 17(45.9%) | 0.64 |
| Yes | 8(61.5%) | 20(54.1%) | ||
| DM | No | 6(46.2%) | 15(54.1%) | 0.724 |
| Yes | 7(53.8%) | 22(45.9%) | ||
| Smoking | No | 7(53.8%) | 17(45.9%) | 0.623 |
| Yes | 6(46.2%) | 20(54.1%) | ||
| GLS | -19.4±2.6 | -15.2±2.8 | <0.0001 | |
| GCS | -25±4.9 | -21±5.4 | 0.01 | |
Table 1: Comparison of some demographic and clinical data between the two studied groups
HTN (Hypertension), DM (Diabetes Mellitus), GLS (Global longitudinal strain), GCS (Global circumferential strain)
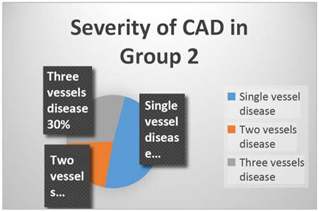
In this study we found 18 patients (49%) with single vessel disease, 8 patients (21%) with two vessels disease and 11 patients (30%) with three vessels disease. (Figure 1)
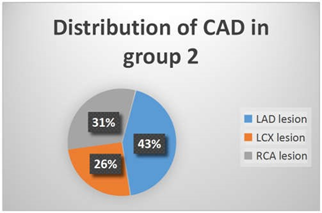
In group 2 we found 29 patients (43%) with LAD lesion, 17 patients (26%) with LCX lesion and 21patients (31%) with RCA lesion. (Figure 2)
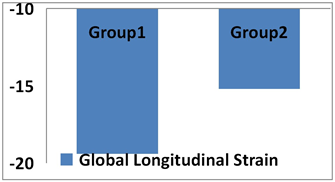
We found that there was statistically significant difference in GLS in group (2) in comparison to group (1) and the mean ±SD of GLS of group 1 was -19.4±2.6 versus -15.2±2.8 in group 2, and P value was highly significant (P < 0.0001). (Figure 3)
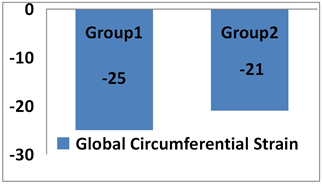
We found that there was statistically significant difference in GCS in group 2 in comparison to group 1 and the mean ± SD of GCS of group 1 was -25±4.9 versus -21±5.4 in group 2 and P value highly significant (P = 0.01)(Figure 4)
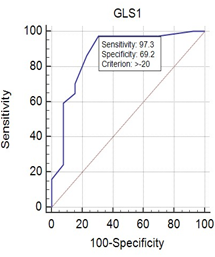
The optimal cut-off value for GLS was -20 and it had a positive predictive value of 90% (95% CI = 79.9 to 95.322) and its negative predictive value was 90% (95% CI = 55.73 to 98.473) with a sensitivity for detection of significant CAD in our studied group equals to 97 % and with a specificity equals to 69 % (Figure 5).The positive likelihood was 3.16 and the negative likelihood was 0.039.
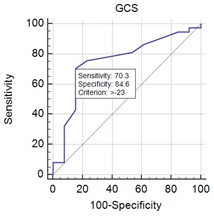
The optimal cut-off value for GCS was -23 and it has a positive predictive value of 92 % (95% CI = 84.93 to 96.76) and its negative predictive value was 49.9 % (95% CI = 29.98 to 69.91) with a sensitivity for detection of significant CAD in our studied group equals to 70 % and with a specificity equals to 84 %.(Figure 6) .The positive likelihood was 4.57 and the negative likelihood was 0.35
In this study we found no statistically significant difference between patients with single vessel disease Vs two vessel disease and multi vessels disease as regard GLS and GCS (P=0.381) and (P=0.7829) respectively.
In group (2) there was no statistically significant difference between patients with significant versus non-significant coronary artery lesion as regard territorial longitudinal and circumferential strains irrespective of its artery affected as shown in table 2
So territorial strain analysis couldn’t predict the culprit lesion in our studied population.
| Variables | SLS in Lesion | SCS in lesion | SLS in Normal | SCS in normal | P value of LS | P value of CS |
| LAD | -17.3 | -24.8 | -18.5 | -23.8 | 0.41 | 0.68 |
| LCX | -18.04 | -20.6 | -18.08 | -21.3 | 0.98 | 0.068 |
| RCA | -14.9 | -21.4 | -15.9 | -24.5 | 0.39 | 0.11 |
SLS: Segmental longitudinal strain, SCS: Segmental circumferential strain
Table 2: Comparison between the patients in group 2 as regard segmental (territorial) longitudinal and circumferential strains according to culprit artery disease
Discussion
In this study we found that no statistically significant difference between the two groups as regard age, gender, hypertension, diabetes mellitus or smoking.
This is in agreement with Schreoder., et al. 2016, who studied 268 patients with clinical suspicion of ACS with non-diagnostic ECG and cardiac biomarkers and they found that there were 110 patients (41%) with significant CAD by coronary angiography, with the exception of diabetes and hypertension which were more common in patients with significant CAD.(11) Also ,this is in agreement with Eek., et al. 2010 who studied 61 patients with the diagnosis of NSTEMI and 2D STE done for correlation between GLS and GCS with the infarct size of myocardium detected by CMR. [12]
Also the results of current study are in agreement with Keddeas., et al. 2016, who studied 60 patients with NSTEMI to compare between patients with and without acute total occlusion as regard global and regional longitudinal strain and they found that 33 (55%) patients had acute total occlusion and 27 (45%) patients without acute total occlusion. [9]
In our study we had 48 patients (49%) with single vessel disease, 20 patients (21%) with two vessels disease and 32 patients (30%) with three vessels disease.
This was in agreement with Choi., et al. 2009 ,who studied 96 patients sent for evaluation of chest pain and they found that 38 (39%) patients had three vessel disease. [3]
And this was in agreement with Schreoder J., et al. 2016 who studied 268 patients with clinical suspicion of ACS with non-diagnostic ECG and cardiac biomarkers and they found 110 patients (41%) with significant CAD and they found 50 patients (45%) with single vessel disease, 32 patients(30%) with two vessels disease and 28 patients (25%) with three vessels disease. So, the prevalence of multivessel disease in patients without abnormal ECG and non-elevated cardiac biomarkers is not uncommon. [11]
In our study we had LAD involvement in 29 patients (43%), LCX involvement in 17 patients (26%) and RCA involvement in 21 patients (31%).
This was in agreement with Choi., et al. 2009, who studied 96 patients sent for evaluation of chest pain and in the low risk group (patients with single or two vessel disease) the LAD involvement occurs in 24 patients(85%) , LCX involvement occurs in 8 patients (28%) and RCA involvement occurs in 5 patients (17%). [3]
Also this was in agreement with Moaref A., et al. 2015 who studied 37 patients with clinical diagnosis of ACS and 26 patients (72%) had LAD stenosis, 15 patients (41%) had LCX stenosis and 14 patients (38%) had RCA stenosis [10].
So LAD is likely to be the most common artery involved in patients with CAD. In our study we found that there was statistically significant difference between the two groups as regard Global Longitudinal Strain
The mean and SD of GLS of group 1 was 19.4±2.6 versus 15.2±2.8 in group 2 and P value was highly significant (P < 0.0001) and this is in agreement with Schreoder., et al. 2016 who studied 268 patients with clinical suspicion of ACS with non-diagnostic ECG and cardiac biomarkers and they found 110 patients (41%) with significant CAD and the mean and SD of GLS of patients without significant CAD was 21.1±7.5 versus 16.6±4.2 in patients with significant CAD and P value was significant (P = 0.014). [11]
Also this is in agreement with Moaref., et al. 2015, who studied 37 patients with clinical diagnosis of ACS and the mean and SD of GLS of patients with significant CAD was 17.04±4.26 versus 20.78±2.28 in control group, and P value was significant (P = 0.002). [10]. Also this is in agreement with Nucifora., et al. 2010, who studied 182 patients who were referred for MSCT coronary angiography due to increased risk profile or stable chest pain, They found that the mean and SD of GLS of patients without significant CAD was 19.5±1.7 versus 15.8±1.9 in patients with significant CAD and P value was significant (P <0.001).(13) In our study we found that there was statistically significant difference between the two groups as regard Global Circumferential Strain , the mean and SD of GCS of group 1 was 25±4.9 versus 21±5.4 in group 2 and P value highly significant (P = 0.01).
And this is in agreement with Schreoder., et al. 2016, who studied 268 patients with clinical suspicion of ACS with non-diagnostic ECG and cardiac biomarkers and they found 110 patients (41%) with significant CAD and the mean±SD of GCS of patients without significant CAD was 23.1±5.5 versus 17.8±4.8 in patients with significant CAD and P value was significant (P = 0.006). [11]
Also this is in agreement with Grenne., et al. 2010, who studied 111 patients with suspected ACS and all patients underwent coronary angiography and 2DSTE to assess territorial longitudinal and circumferential strains as well as CMR for quantification of infarct size, the results showing significant difference in strain between patients with and without complete occlusion P value was <0.0001. [14]
In our study we found no statistically significant difference between patients with single vessel disease Vs two vessel disease and multi vessel disease as regard GLS and GCS. This is in disagreement with Choi., et al. 2009, who studied 96 patients sent for evaluation of chest pain and they found statistically significant difference between patients with single vessel disease or two vessel disease versus multi vessels disease as regard GLS as the mean ±SD of GLS of patients with one or two vessel disease was -19.4±2.4 versus -18.0±2.3 in patients with multi vessels disease and P value = 0.032. [3]
This discrepancy between results may be due to different study sample size or may be due to different type of patients in their study as they studied patients with stable angina as well as ACS patients and the patients with stable angina were about 50% of study population.
The cut-off value for GLS in our study is -20 and it has a positive predictive value of 90% and its negative predictive value was 90% and the sensitivity of GLS for detection of significant CAD in our studied group was 97% and the specificity of GLS for detection of significant CAD in our studied group was 69%. This was in agreement with Moaref., et al. 2015, who studied 37 patients with clinical diagnosis of ACS and determine the sensitivity of 2DSTE in detection of CAD to be 91.7% but they cannot determine specificity due to absence of angiographic data of the control group. [10]
This is in agreement with Eek., et al. 2010, who studied 61 patients with the diagnosis of NSTEMI and 2D STE done for correlation between GLS and GCS with the infarct size of myocardium detected by CMR, they found that the cut-off value for GLS was -13.8 and it had a positive predictive value of 85% and negative predictive value of 96% and the sensitivity of GLS for detection of significant CAD in patients with large infarction was 85% and the specificity of GLS for detection of significant CAD in patients with large infarction was 96%. [12]
And this is in agreement with Schreoder., et al. 2016, who studied 268 patients with clinical suspicion of ACS with non-diagnostic ECG and cardiac biomarkers and they found the cut-off value for GLS was -18.8 and the sensitivity of GLS for detection of significant CAD was 82% and the specificity of GLS was 72%. [11]. Also this is in agreement with Nucifora., et al. 2010, who studied 182 patients who referred for MSCT coronary angiography due to increased risk profile or stable chest pain and found that cutoff value >-17.4 with a 83% sensitivity and a 77% specificity. [13]
This was comparable with Choi., et al. 2009 ,who studied 96 patients sent for evaluation of chest pain (stable and ACS) and they found that cut-off value for GLS as diagnostic for high risk CAD was -19 with a sensitivity of 76% and a specificity of 74%. [3]
Also, our results were different from Keddeas., et al. 2016, who studied 60 patients with NSTEMI to compare between patients with and without acute total occlusion as regards global and regional longitudinal strain and they found that cut-off value for GLS as diagnostic for occlusive NSTEMI was -15.5 with a sensitivity of 68.9 % and a specificity of 77.7%.and the positive predictive value was 70% and the negative predictive value was 57.7%. [9]. Our cut-off value was different from Anwar., et al. 2013, who studied 25 patients referred to coronary angiography with clinical suspicion of CAD. The 2DE assessment of WMA and evaluation of LS using STE were performed using left ventricular 17-segments models, to examine the accuracy of global and segmental longitudinal strain for the detection of CAD compared with visual assessment of WMA using coronary angiography as a golden standard as the cut-off value was -11 ,which may be lower than our cut-off value as his patients group differ from our patients as they were higher risk patients with positive stress, chest pain CCS class III or patients with chest pain and impaired LVEF. [8]
Also, the sensitivity of Anwar 2013, cut-off value was 68.6% and the specificity was 77%.(8) The cut-off value for GCS was -23 and it has a positive predictive value of 92 % and negative predictive value was 49.9% and the sensitivity of GCS for detection of significant CAD in our studied group was 70 % and the specificity of GCS for detection of significant CAD in our studied group was 84 %.
This is in agreement with Eek., et al. 2010, who studied 61 patients with diagnosis of NSTEMI and 2D STE done for correlation between GLS and GCS with the infarct size of myocardium detected by CMR as they found the cut-off value for GCS was -19.2 and it has a positive predictive value of 47% and negative predictive value of 89% and the sensitivity of GCS for detection of significant CAD in patients with large infarction was 62% and the specificity of GCS for detection of significant CAD in patients with large infarction was 81%. [12] Also this is in agreement with Grenne., et al. 2010, who studied 111 patients with suspected ACS and all patients underwent coronary angiography and 2DSTE to assess territorial longitudinal and circumferential strains as well as CMR for quantification of infarct size, they found that cut-off value for territorial circumferential strain was -10 with 90% sensitivity and 88% specificity to differentiate between occlusive and non-occlusive NSTEMI. [14]
And this is in agreement with Schreoder., et al. 2016, who studied 268 patients with clinical suspicion of ACS with non-diagnostic ECG and cardiac biomarkers and they found the cut-off value for GCS was -21.7 and the sensitivity of GCS for detection of significant CAD was 87% and the specificity of GCS was 76%. [11]
In our study we found that GLS > -20 has 97% sensitivity so it can be used as a screening test for patients with ACS so we can call it a good negative test.
Also, GCS is less sensitive and specific than GLS in detection of significant CAD.
In our study we found that there was no statistically significant difference in the segmental (territorial) longitudinal and circumferential strains in group 2 between patients with and without LAD , LCX or RCA lesions which signifies that we couldn't predict or identify the culprit artery by 2D STE in patients included in our study , This finding may be related to the relatively small number of the patients included , the way we included various LV segments into specific arterial territories as we considered that LAD supplying 9 segments , LCX supplying 4 segments and RCA supplying 3 segments regardless the coronary dominance , coronary variability and coronary overlap, also we had 19 patients with more than single vessel disease and only 18 patients had single vessel disease so determination of culprit artery was not possible.
This is in agreement with Moaref., et al. 2015 who studied 37 patients with clinical diagnosis of ACS and the finding of coronary angiography completely matched with finding of 2D strain in 20 patients (55%) in whom both LAD and LCX or RCA affected and both territories impaired in STE (anteroseptal and inferolateral territories) and partially matched in 10 patients (27%) and not matched in 6 patients (16%), one patient was excluded due to sub-optimal echocardiographic views. [10] So, territorial strain either longitudinal or circumferential until now and up to our experience cannot predict the culprit lesion.
Conclusion
From the present study we concluded that:
- 2D speckle tracking Echocardiography using global and segmental longitudinal strain can predict ACS in patients with acute chest pain and non-diagnostic ECG and cardiac biomarkers.
- 2D speckle tracking Echocardiography using global circumferential strain can also predict ACS in patients with acute chest pain and non-diagnostic ECG and cardiac biomarkers
- Three vessels disease is not uncommon in patients presented with low risk unstable angina as 30% of our patients had multivessels disease on coronary angiography. We couldn’t differentiate between patients with single , two versus three vessels disease by 2D speckle tracking Echocardiography (longitudinal and circumferential strains)
- We couldn’t localize the artery involved in patients with ACS by Regional longitudinal and Circumferential strain analysis.
- The global longitudinal strain is highly sensitive for detection of CAD so it can be used as screening test and can rule out ACS in patients presented to Emergency Department with symptoms suggesting ACS.
Recommendation
Patients with acute chest pain and non-conclusive ECG findings and non-diagnostic cardiac troponin should undergo echocardiographic examinations with strain analysis as early as possible to differentiate between patients with ACS and non-cardiac complaints and to facilitate early and safely discharge of patients with normal strains to avoid unnecessary admission and decrease the cost of acute chest pain care.
Limitation
The accuracy of STE largely depends on image quality; however, many patients were excluded from our study because of inadequate image quality, Also, radial strain was not performed in the present study. However, the myocardial fibers most susceptible to ischemia are the longitudinally orientated fibers that are located subendocardially, that is why measurements of longitudinal deformation are thought to be the most sensitive markers of CAD.
The accuracy of STE largely depends on image quality; however, many patients were excluded from our study because of inadequate image quality, Also, radial strain was not performed in the present study. However, the myocardial fibers most susceptible to ischemia are the longitudinally orientated fibers that are located subendocardially, that is why measurements of longitudinal deformation are thought to be the most sensitive markers of CAD.
The assessment of coronary angiography was done qualitatively by a single cardiologist who was blinded to the results of strain analysis. The analysis of coronary angiography included only the presence or absence of significant coronary stenosis.
Territorial strain is based on a schematic distribution of territories and thus ignores the individual variation in coronary topography and dominance.
At last, this study is limited by the relatively small sample size.
Acknowledgment
My great thanks to my professors,Dr Mansour Mostfa head of cardiology department AlAzhar university ,Wael Attia professors Cardiology department Alazhar university and Walaa farid the head of department cardiology department in Menufia University for help and assistance too much.
My great thanks to my professors,Dr Mansour Mostfa head of cardiology department AlAzhar university ,Wael Attia professors Cardiology department Alazhar university and Walaa farid the head of department cardiology department in Menufia University for help and assistance too much.
References
- Habibollah Saadat., et al. “Exploitation of resources and cardiovascular outcomes in low-risk patients with chest pain hospitalized in coronary care units”. International Journal of General Medicine 4 (2011): 695-698.
- Patricia Reant., et al. “Experimental validation of circumferential, longitudinal, and radial 2-dimensional strain during dobutamine stress echocardiography in ischemic conditions”. Journal of the American College of Cardiology 51.2 (2008): 149-157.
- Jin-Oh Choi., et al. “Longitudinal 2D strain at rest predicts the presence of left main and three vessel coronary artery disease in patients without regional wall motion abnormality”. European Journal of Echocardiography 10.5 (2009): 695-701.
- F M Fesmire., et al. “Usefulness of automated serial 12-lead ECG monitoring during the initial emergency department evaluation of patients with chest pain”. Annals of Emergency Medicine 1 (1998): 3-11.
- Antman EM., et al. “Cardiac-specific troponin I levels to predict the risk of mortality in patients with acute coronary syndromes”. The New England Journal of Medicine 335.18 (1996): 1342-1349.
- Lang RM., et al. “Recommendations for cardiac chamber quantification by echocardiography in adults: an update from the American society of echocardiography and the European association of cardiovascular imaging”. European Heart Journal: Cardiovascular Imaging 16.3 (2015): 233-271.
- Mondillo S., et al. “Speckle-tracking echocardiography: a new technique for assessing myocardial function”. Journal of Ultrasound in Medicine 30.1 (2011): 71-83.
- Anwar A M. “Accuracy of two-dimensional speckle tracking echocardiography for the detection of significant coronary stenosis”. Journal of Cardiovascular Ultrasound 21.4 (2013): 177-182.
- Keddeas V W., et al. “Role of 2D speckle tracking echocardiography in predicting acute coronary occlusion in patients with non ST-segment elevation myocardial infarction”. The Egyptian Heart Journal 69.2 (2017):103-110.
- Moaref A., et al. “Evaluation of Global and Regional Strain in Patients with Acute Coronary Syndrome without Previous Myocardial Infarction”. International Cardiovascular Research Journal 10.1 (2016): 6-11.
- Schroeder J., et al. “Myocardial deformation by strain echocardiography identifies patients with acute coronary syndrome and non-diagnostic ECG presenting in a chest pain unit: a prospective study of diagnostic accuracy”. Clinical Research in Cardiology 105.3 (2016): 248-256.
- Christian Eek., et al. “Strain echocardiography predicts acute coronary occlusion in patients with non-ST-segment elevation acute coronary syndrome”. European Journal of Echocardiography 11.6 (2010):501-508.
- Gaetano Nucifora., et al. “Incremental value of subclinical left ventricular systolic dysfunction for the identification of patients with obstructive coronary artery disease”. American Heart Journal 159.1 (2010): 148-157.
- Bjørnar Grenne., et al. “Acute coronary occlusion in non-ST-elevation acute coronary syndrome: outcome and early identification by strain echocardiography”. Heart 96.19 (2010): 1550-1556.
Citation:
Abdulaziz Aboshahba., et al. “Correlation Between 2D Speckle Tracking Echocardiography with Non-Diagnostic ECG and Cardiac Enzymes in Assessment of Myocardial Ischaemia”. Therapeutic Advances in Cardiology 3.2 (2020): 20-31.
Copyright: © 2020 Abdulaziz Aboshahba., et al. This is an open-access article distributed under the terms of the Creative Commons Attribution License, which permits unrestricted use, distribution, and reproduction in any medium, provided the original author and source are credited.


 Scientia Ricerca is licensed and content of this site is available under a Creative Commons Attribution 4.0 International License.